
In August, over the month state unemployment rates were higher in six states and the District of Columbia, lower in one state, and stable in the remaining 43. Arizona’s seasonally adjusted unemployment rate remained the same over the month at 3.4%. South Dakota had the lowest jobless rate in August at 2.0%, followed by Vermont, at 2.2%, and North Dakota, at 2.3%. The District of Columbia had the highest unemployment rate at 5.7%, followed by Nevada, at 5.5%. Twenty-five states and the District of Columbia had over-the-year unemployment rate increases, while four states had decreases, the largest of which was Arizona (-0.7 percentage points). Twenty-one states had jobless rates that were not noticeably different from those of a year prior. –Delaney O’Kray-Murphy
MORE NEWS: Here are Arizona’s Most Admired Companies for 2024
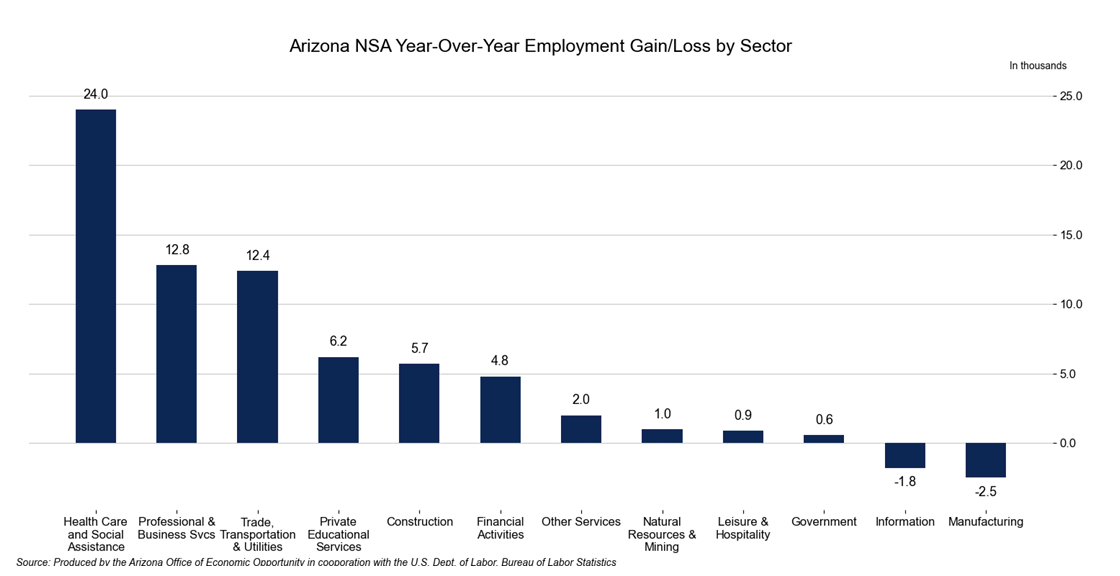
Total nonfarm employment in Arizona increased by 66,100 jobs over the year in August, with the seasonally adjusted unemployment rate remaining at 3.4%. The U.S. seasonally adjusted unemployment rate decreased 0.1 percentage point to 4.2% in August. Arizona’s non-seasonally adjusted total nonfarm employment increased by 43,600 over the month, slightly lower than the pre-pandemic average of 54,000. Employment gains were reported in government (26,200), private educational services (7,500), leisure & hospitality (6,700), professional & business services (3,900), health care and social assistance (3,200), information (200), and natural resources & mining (100). Employment losses were reported in manufacturing (-1,700); other services (-1,300); financial activities (-600); trade, transportation, & utilities (-400); and construction (-200). –Delaney O’Kray-Murphy
Nearly half of all renters in the U.S. (49.7%) are housing cost-burdened according to the 2023 American Community Survey (ACS) one-year estimates released on September 12. For Arizona, the figure was more than half, at 52.0%, ranking it the fifth-highest state for the share of renter households paying more than 30% of their income on housing costs. The release included several new tables relating to housing costs, one of which separates housing cost data by race and ethnicity. Based on the new tables, Black or African American alone renter households, at 56.2% nationally, represented the highest percentage of cost-burdened groups. For Arizona, it was even higher, at 66.2%, but this was not the race group with the largest share of rent burden in the state. More than 73% of Native Hawaiian and Other Pacific Islander rental households in Arizona were housing cost-burdened. The annual cost of homeowners insurance by mortgage status is another new table for 2023. Of the 85.7 million homeowners in the U.S., 5.4 million of them paid $4,000 a year or more for homeowner’s insurance. Florida had the highest number of homeowners paying that much for property insurance, at 1.2 million. Arizona had far fewer than that with only 43,761 households paying $4,000 a year or more. The $1,000 to $1,499 range was the amount of homeowners insurance costs that the largest number of households in Arizona paid in 2023, with or without a mortgage. This was true for the U.S. as well. The median household income for Arizona in 2023 was $77,315, just below the national figure of $77,719. Massachusetts had the highest median household income at $99,858, followed by New Jersey, at $99,781, and Maryland, at $98,678. Mississippi posted the lowest median household income of any state at $54,203. –Valorie Rice
The August Consumer Price Index for All Urban Consumers (CPIU) rose 0.2% on a seasonal basis, the same increase as in July. The shelter index increased 0.5% for the month and was a primary factor in the overall rise. The index for food rose 0.1%, while the energy index was down 0.8% over the month. The index for all items less food and energy was up 0.3% in August, after rising 0.2% in July. The annual inflation rate for August was 2.5%, continuing its downward trend for the fifth consecutive month and reflecting the smallest 12-month increase since February 2021. The index for all items less food and energy posted a 3.2% 12-month change, the same increase as in July. –Valorie Rice
Use your cursor as a tooltip and click titles on/off in the legend at the bottom of the chart to make comparisons.
Producer prices increased 0.2% in August on a seasonally adjusted basis after being flat in July. The change in total final demand can be attributed to final demand services, which rose 0.4% over the month while final demand goods were unchanged. A decrease in energy prices offset increases in food (eggs in particular) and other areas for final demand goods. The 12-month unadjusted change in the Producer Price Index was 1.7% in August, down from 2.1% in July and 2.7% in June. –Valorie Rice
According to the September 17th State Job Openings and Labor Turnover (JOLTS) report, the job openings rate decreased in four states, increased in one state, and was little changed in all other states. The job openings rates for Arizona were 4.9% for July, 5.6% for June, and 4.8% for May. The number of job openings decreased in six states, increased in three states, and changed little in all other states. The largest decreases in the number of job openings were seen in New York (-91,000) and Minnesota (-41,000). Virginia had the largest increase (+28,000). Hire rates decreased in one state, increased in four states, and little changed in all other states. California and Michigan had the largest increases with +0.7 percentage points each. The hire rates for Arizona were 4.3% for July, 3.9% for June, and 3.8% for May. The number of hires decreased in one state, increased in six states, and changed little in all others. California (+119,000) had the largest increase in hire levels. The number of layoffs and discharges decreased in one state, increased in eight states, and was little changed in all other states. Nationally, the layoffs and discharges rate and number of layoffs and discharges were little changed. –Alex Jaeger