
Arizona job growth sputtered last year, according to an analysis from the Economic and Business Research Center (EBRC).
Each year the U.S. Bureau of Labor Statistics (BLS) revises national, state, and local job and unemployment data for the previous one to two years, with occasional revisions going further back. This process is known as benchmarking. In some years, these revisions are significant. This is one of those years.
DEEPER DIVE: Read all the Ranking Arizona Top 10 lists here
INDUSTRY INSIGHTS: Want more news like this? Get our free newsletter here
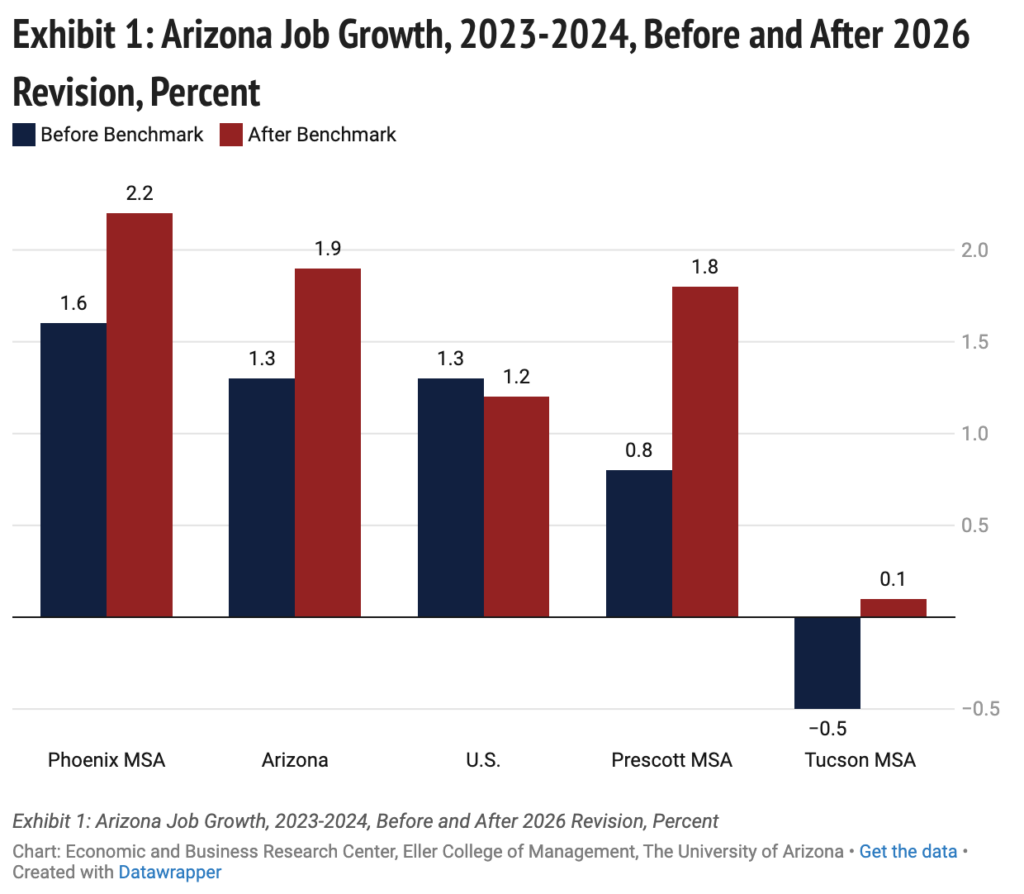
In particular, the BLS has significantly revised nonfarm payroll jobs for the state and its local economies in 2024. Normally, the revisions to data two years prior are fairly small, but that is not the case this time. On an annual average basis, state nonfarm payroll jobs in 2024 were revised up by 21,300 or 0.7%. That increased the 2024 growth rate from 1.3% to 1.9% (Exhibit 1). In addition, this large revision essentially returned the 2024 growth rate to very near the increase suggested by the original preliminary estimates. Note that the growth rate for Arizona changed much more than did the national pace, according to the latest revised estimates.
The situation was similar for the Phoenix, Tucson, and Prescott MSAs. Phoenix MSA job growth was revised up from 1.6% to 2.2%. Prescott growth was increased from 0.8% to 1.8%. Tucson’s job loss of -0.5% was revised to a small gain of 0.1%.
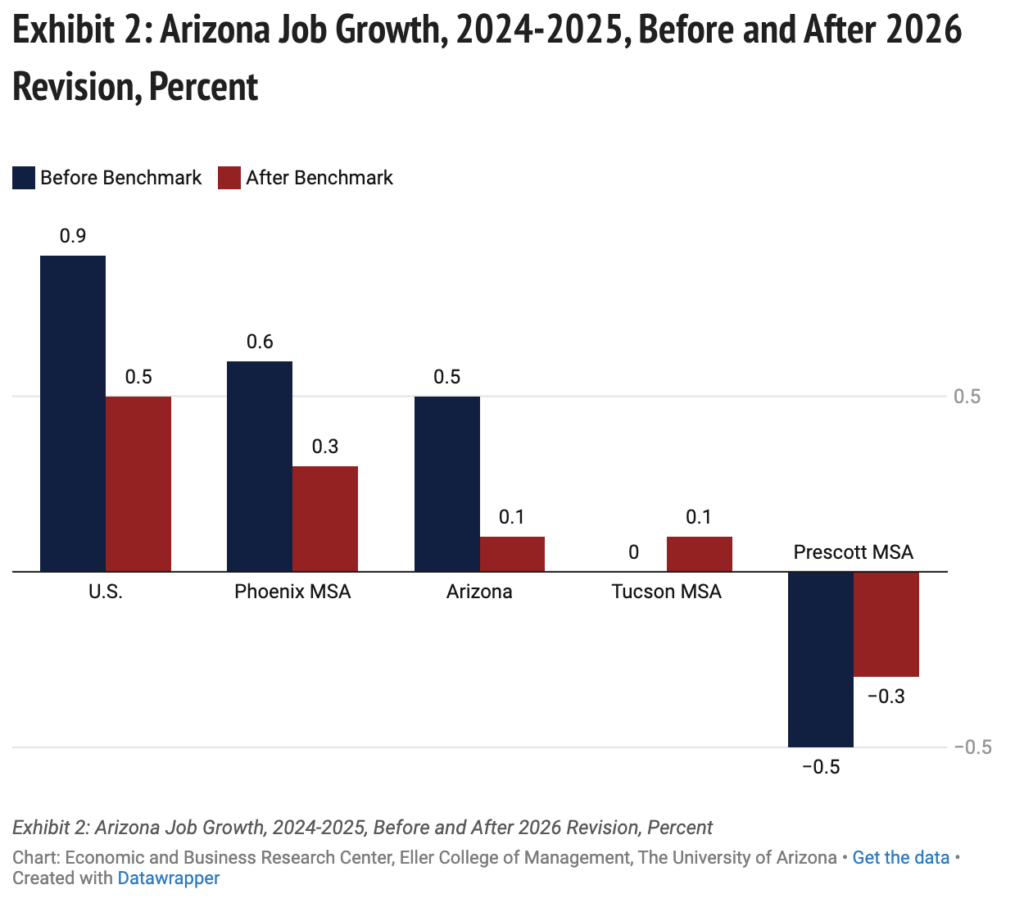
The benchmark revision to 2025 was much smaller, with the state annual average increased by 8,700 jobs (0.3%). However, since the 2024 data was revised up so significantly, this resulted in a downward revision to the 2025 growth rate for Arizona, Phoenix, and the U.S. As Exhibit 2 shows, Arizona job growth in 2025 was revised down from 0.5% to 0.1%. For the Phoenix MSA, growth was halved, from 0.6% to 0.3%. Tucson growth increased from 0.0% to 0.1% and Prescott job loss was revised from -0.5% to -0.3%.
Overall, the revision to 2024 estimates represents a confusing about-face in the published data. It’s not at all clear why the job data was revised down so significantly initially, only to be revised back up a year later. Even so, the pattern of slowing job growth as the economy has gained distance from the pandemic recovery remains. Further, the very slow job growth generated last year suggests that federal government policies (policy uncertainty, tariffs, mass deportations, elevated interest rates), combined with demographic pressures of the aging of the baby boom generation, generated a significant drag on job growth in 2025.
The state’s unemployment rate for 2024 was 3.7%, according to the revised estimate, up from 3.6% in the preliminary data. Last year, the state rate increased to 4.3% (revised), compared to 4.2% in the preliminary data. The national unemployment rate was 4.0% in 2024 and 4.3% in 2025 (revised).
According to the revised data, Arizona added just 4,500 jobs last year on an annual average basis. That translated into 0.1% growth, which was well below the nation at 0.5%. As Exhibit 3 shows, Arizona gains were driven primarily by private education and health care, with support from leisure and hospitality; financial activities; trade, transportation, and utilities; and natural resources and mining. These gains were significantly offset by losses in professional and business services; construction; manufacturing; government; other services; and information.
Exhibit 3: Arizona Net Job Change (Thousands, Revised) and 2024 Annual Wages per Worker
The Phoenix MSA added 6,400 jobs in 2025 on an annual average basis, which translated into 0.3% growth. Like the state, private education and health services drove gains, with help from trade, transportation and utilities; leisure and hospitality; financial activities; natural resources and mining; and government (Exhibit 4). Professional and business services; construction; other services; manufacturing; and information all lost jobs last year.
Exhibit 4: Phoenix MSA Net Job Change (Thousands, Revised) and 2024 Annual Wages per Worker
Job in the Tucson MSA were up slightly last year, rising by just 400 for 0.1% growth. Again, private education and health services added the most jobs, with significant gains as well in financial activities (Exhibit 5). Leisure and hospitality jobs were also up as were jobs in natural resources and mining. These gains were significantly offset by losses in government; trade, transportation, and utilities; information; construction; and professional and business services. Jobs were stable in other services and manufacturing.
Exhibit 5: Tucson MSA Net Job Change (Thousands, Revised) and 2024 Annual Wages per Worker
Current estimates suggest that Prescott MSA jobs declined by 200 or -0.3% last year on an annual average basis. As Exhibit 6 shows, job gains in financial activities; leisure and hospitality; government; private education and health services; mining and construction; and other services were more than offset by losses in professional and business services; manufacturing; trade, transportation, and utilities. Jobs were stable in information.