
The U.S. unemployment rate changed little at 4.3% with total nonfarm payroll employment increasing by 178,000 in March, according to the Bureau of Labor Statistics’ April 3rd employment situation summary. Job gains occurred in Health Care (76,000), Transportation and Warehousing (21,000), and Social Assistance (14,000). Job losses occurred in Federal Government (-18,000) and Financial Activities (-15,000), while other major industries showed little or no change in employment. In March, average hourly earnings rose by 9 cents, or 0.2%, to $37.38. The average workweek for all employees on private nonfarm payrolls edged down by 0.1 hour to 34.2 hours in March. Employment in January was revised up by 34,000, and employment in February was revised down by 41,000. -Delaney O’Kray-Murphy
DEEPER DIVE: Read all the Ranking Arizona Top 10 lists here
INDUSTRY INSIGHTS: Want more news like this? Get our free newsletter here
The number of job openings was little changed at 6.9 million in February, according to the Bureau of Labor Statistics’ March 31st Job Openings and Labor Turnover Summary (JOLTS). Over the month, hires decreased to 4.8 million, and total separations changed little at 5.0 million. Within separations, quits (3.0 million) and layoffs and discharges (1.7 million) changed little. In February, the number of job openings decreased in accommodation and food services (-211,000) and in mining and logging (-12,000), and the rate of job openings was little changed at 4.2%. The number of hires decreased to 4.8 million (-498,000) and was down by 387,000 over the year, with the hire rate falling over the month to 3.1%- the lowest since April 2020. Within separations, the number of total separations decreased in federal government (-16,000), while the number of quits decreased in accommodation and food services (-119,000), wholesale trade (-35,000), and federal government (-6,000). Quits increased in nondurable goods manufacturing (+21,000). The number of layoffs and discharges increased in retail trade (+72,000) and decreased in nondurable goods manufacturing (-26,000 and federal government (-3,000). -Delaney O’Kray-Murphy
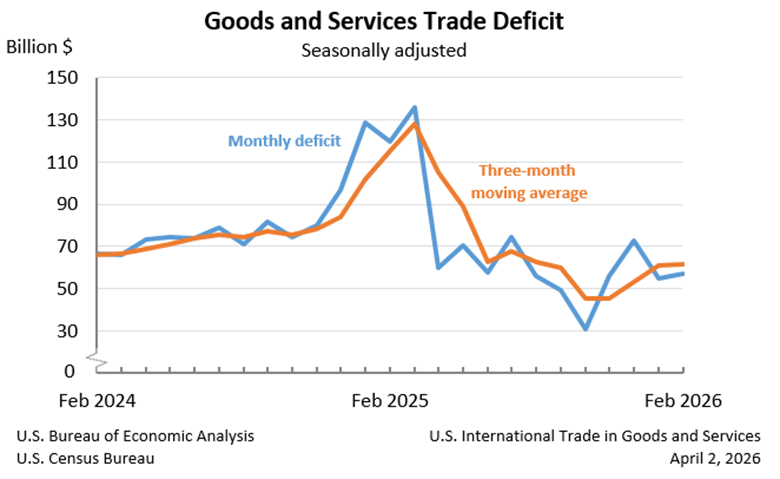
The U.S. goods and services trade deficit was $57.3 billion in February, up $2.7 billion from a revised $54.7 billion in January. Exports rose $12.6 billion to $314.8 billion, and imports rose $15.2 billion to $372.1 billion. The increase in the goods and services deficit reflects an increase in the goods deficit of $2.5 billion and a decrease in the services surplus of $0.2 billion. Year to date, the goods and services deficit decreased 54.8% from the same period last year. The largest surpluses, in billions, were with Switzerland ($7.8), Netherlands ($6.8), and Hong Kong ($6.6), while the greatest deficits were with Taiwan ($21.1), Mexico ($16.8), and Vietnam ($16.5). -Delaney O’Kray-Murphy
Population growth slowed in most areas of the nation between 2024 and 2025. The U.S. Census Bureau recently released 2025 population estimates for counties and metropolitan areas, providing context as to where population growth diminished the most and where it held steady or even increased. Among counties with populations of 20,000 or more, nine of the top 10 fastest-growing counties were located in the South, with counties in Texas and Georgia accounting for seven of them. The one outlier was Pinal County, Arizona, which ranked as the seventh fastest, at a growth rate of 4.6%. Within the top 10 counties adding the largest number of people between 2024 and 2025, Maricopa County ranked third, and Pinal County ranked tenth. While most counties in Arizona added population over the year, the rate of growth slowed compared to the previous year. This was the case for most metropolitan areas in the U.S. and in Arizona. Yuma was highlighted as being among three metro areas in the U.S. with the sharpest percentage point decline in growth rates, moving from 3.3% in 2023-2024 to 1.4% in 2024-2025. The other two metropolitan areas with steep declines in growth rates were Laredo, TX, and El Centro, CA, which, like Yuma, are situated along the U.S.-Mexico border. The Phoenix metro area ranked fourth in the nation for numeric growth. The top five fastest-growing metro areas in the nation for 2024-2025 were located in Florida and South Carolina, with Ocala, FL, leading the nation with a 3.4% growth rate. In comparison, Yuma was the fastest-growing Arizona metro area, with a growth rate of 1.4%. -Valorie Rice

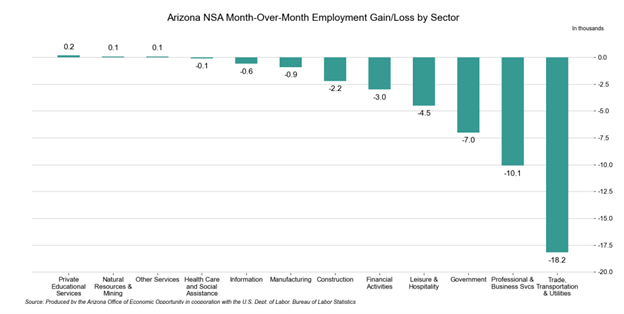
Total nonfarm employment in Arizona decreased by 19,400 jobs over the year in January, with the seasonally adjusted unemployment rate increasing to 4.5% from 4.4% in December. The U.S. seasonally adjusted unemployment rate decreased by 0.1 percentage points over the month to 4.3% in January. Arizona’s non-seasonally adjusted nonfarm employment decreased by 46,200 in January, slightly better than the -51,000 pre-pandemic average. Employment gains were reported in Private Educational Services (200), Natural Resources & Mining (100), and Other Services (100). Job losses occurred in Trade, Transportation & Utilities (-18,200), Professional & Business Services (-10,100), Government (-7,000), Leisure & Hospitality (-4,500), Financial Activities (-3,000), Construction (-2,200), Manufacturing (-900), Information (-600), and Health Care and Social Assistance (-100). -Delaney O’Kray-Murphy
Phoenix house prices were up 0.1% over the month and down 1.6% over the year in January based on the latest S&P Cotality Case-Shiller home price indices. New York reported the highest annual gain among the 20 cities, with a 4.9% increase in January, followed by Chicago and Cleveland with annual increases of 4.6% and 3.6%, respectively. Tampa posted the lowest return in January, dropping 2.5%. The 20-City composite posted a year-over-year increase of 1.2%, slightly down from a 1.4% gain last month. The U.S. national home price index recorded a 0.9% annual increase in the first month of 2026. -Delaney O’Kray-Murphy