Arizona and Montana had the largest increase in state personal income for 2020 at 8.4 percent, according to data from Bureau of Economic Analysis.
Occupational employment and wage data from the Bureau of Labor Statistics indicates that healthcare support occupations make up 4.6 percent of total national employment in 2020 based on the March 31 release. Healthcare and support occupations represent the same percentage for Arizona. Within Arizona, that amount ranges between 5.3 percent in Prescott to 3.4 percent in Yuma. This occupation category covers such jobs as home health aides, nursing assistants, dental assistants, phlebotomists, massage therapists, and the like. The release also focused on one of the lowest-paid categories, food preparation and serving related occupations. The average annual wage for this category in the U.S. was $25,500. Arizona and all metros within the state have a higher annual average wage higher than the nation ranging from $26,140 in Sierra Vista-Douglas to $28,230 in Prescott. The state figure was $26,830.
READ ALSO: The 15 highest paying jobs in Arizona
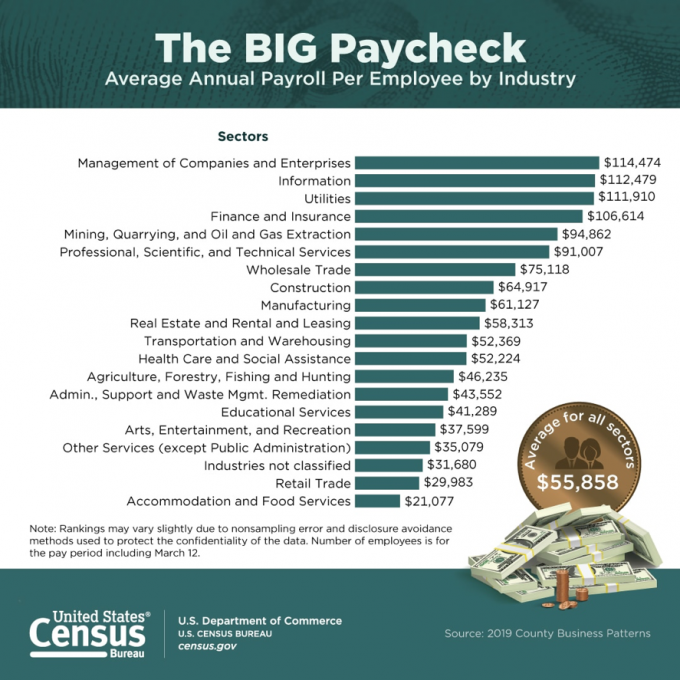
Transportation and warehousing had the largest growth in employees in the U.S. between 2018 and 2019 at 7.5 percent based on 2019 County Business Patterns data released by the Census Bureau on April 22. Total employment grew 1.6 percent in the nation and 2.6 percent in Arizona. The industry with the greatest number of employees in 2019 for both the U.S. and Arizona was health care and social assistance with an annual payroll per employ of $52,224 for the nation and $52,511 in Arizona. Exhibit 1 below indicates that management of companies and enterprises was the industry with the largest annual payroll per employee in the U.S. below indicates that management of companies and enterprises was the industry with the largest annual payroll per employee in the U.S. For Arizona, utilities topped the list at $104,603. Nationally, the average payroll per employee for all sectors was $55,858. The figure was $49,608 for Arizona. Among Arizona counties, Greenlee had the largest average payroll per employee for all sectors at $68,760 followed by Maricopa at $53,032. The largest industry in Greenlee is mining with almost 80 percent of all employees in the county working for that industry, which had an average payroll per employee of $76,804.
Exhibit 1: The 2019 average payroll per employee in the U.S. for all sectors was $55,858 ( $49,608 for Arizona)
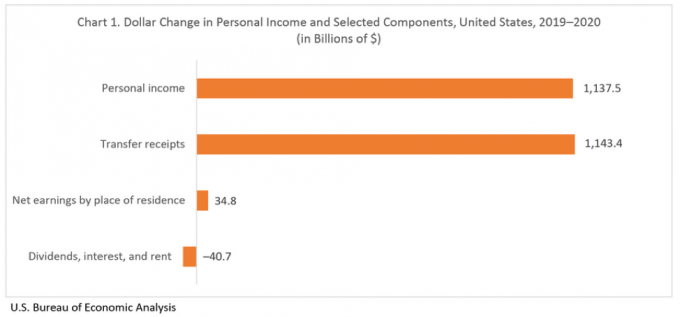
Arizona and Montana had the largest increase in state personal income for 2020 at 8.4 percent, according to preliminary data from Bureau of Economic Analysis released March 24. Wyoming had the smallest increase at 2.4 percent. State personal income in the nation increased 6.1 percent in 2020 compared to 3.9 percent in 2019. Transfer receipts made up for the entire increase in personal income for the year with state unemployment insurance compensation accounting for the largest portion of that. Transfer receipts increased in all states and the District of Columbia. In Arizona, transfer receipts increased 32.4 percent, net earnings rose 3.5 percent, while dividends, interest and rent decreased by 0.9 percent. For the nation, transfer receipts increased 36.6 percent; net earnings increased 0.3 percent; and dividends, interest and rent were down 1.1 percent. Exhibit 2 shows the absolute dollar changes rather than percent.
Exhibit 2: Change in Personal Income 2020
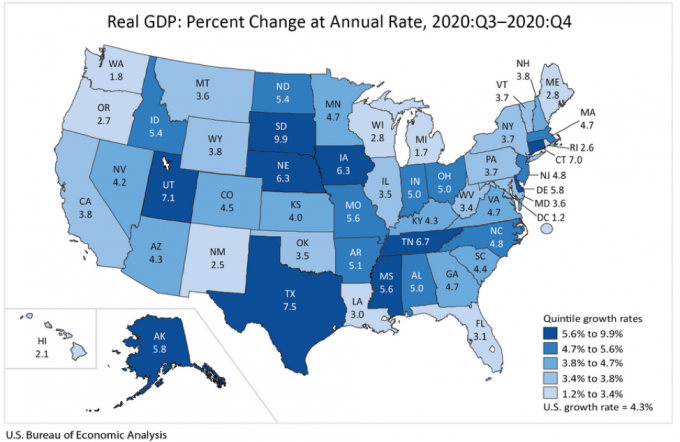
Fourth quarter 2020 real GDP rose in all states and the District of Columbia based on the March 26 Bureau of Economic Analysis release. South Dakota had the highest percent change in real GDP for the fourth quarter at 9.9 percent while the District of Columbia increased 1.2 percent on the lower end. Arizona real GDP increased at an annual rate of 4.3 percent, the same amount as the nation (Exhibit 3).
Exhibit 3: Quarterly Real GDP by State
There were 935 bankruptcy filings in Arizona during March, a drop of 36.2 percent over the same month last year, marking the 15th straight month of decreased bankruptcy filings in the state. Every type of filing has been unchanged or lower throughout the first three months of the year. Year-to-date, total bankruptcies were down 33.4 percent with Chapter 13 (individual debt adjustment) down 55.3 percent compared to the same period a year ago. The Phoenix office decreased 36.3 percent year-to-date while the Tucson office decreased 27.8 percent and the Yuma office was down 14.0 percent. The Phoenix office includes Apache, Coconino, Gila, Maricopa, Navajo, and Yavapai counties. The Tucson office handles Cochise, Graham, Greenlee, Pima, Pinal, and Santa Cruz counties, while the Yuma office represents La Paz, Mohave, and Yuma counties.
Arizona employment posted 86,000 fewer jobs in March year-over-year. That translated into 2.9 percent decrease in employment compared to a 4.4 percent decrease for the nation. Trade, transportation and utilities had a 3.5 percent increase over March of last year, the only sector to report a gain in jobs. Leisure and hospitality had the steepest dive in employment followed by government and professional and business services. Over-the-year job growth in Arizona metro areas for March: Lake Havasu City-Kingman 1.1 percent, Sierra Vista-Douglas 0.0 percent, Prescott -1.2 percent, Phoenix -2.4 percent, , Tucson -4.1 percent, Yuma -4.7 percent and Flagstaff -6.5 percent. The April 15 Arizona Office of Economic Opportunity release reported a seasonally adjusted unemployment rate for Arizona at 6.7 percent for March, compared to a 6.0 percent rate for the U.S.
Valorie Rice is the Senior Business Information Specialist at the Economic and Business Research Center (EBRC) in the University of Arizona’s Eller College of Management.