
Key Takeaways
1. The states at the top of the national risk rankings, like Hawaii, Nebraska, and Alaska, are defined by a combination of high per-capita fatality rates and steep year-over-year surges, with the most dangerous state recording a 50% single-year spike in nighttime pedestrian deaths.
2. The South bears a disproportionate share of the national burden, accounting for seven of the 15 most dangerous states, with multiple Southern states ranking among the highest in the country by both raw fatality volume and per-capita rate.
3. The safest states, like Wyoming, North Dakota, and Idaho, in the nation achieved dramatic year-over-year reductions, with the top performer recording a 75% decline in nighttime pedestrian fatalities in 2024.
When the sun goes down, America’s roads become a more dangerous place for those on foot. Streetlights fall short, crosswalks fade from view, and the speed of traffic leaves little room for error. For years, this nightly risk has persisted quietly across the country, unevenly distributed among states and rarely examined in its full scope. A new study changes that, mapping exactly where nighttime pedestrian danger is rising, where it is retreating, and which states have the furthest to go.
This analysis was conducted by Bader Scott Injury Lawyers, a Georgia-based personal injury law firm, using five years of fatal nighttime pedestrian crash data (2020 to 2024) from the Fatality Analysis Reporting System (FARS), administered by the National Highway Traffic Safety Administration (NHTSA). The study calculated average annual fatalities, per-capita crash rates, year-over-year trends, and a composite Nighttime Pedestrian Risk Score for all 50 U.S. states.
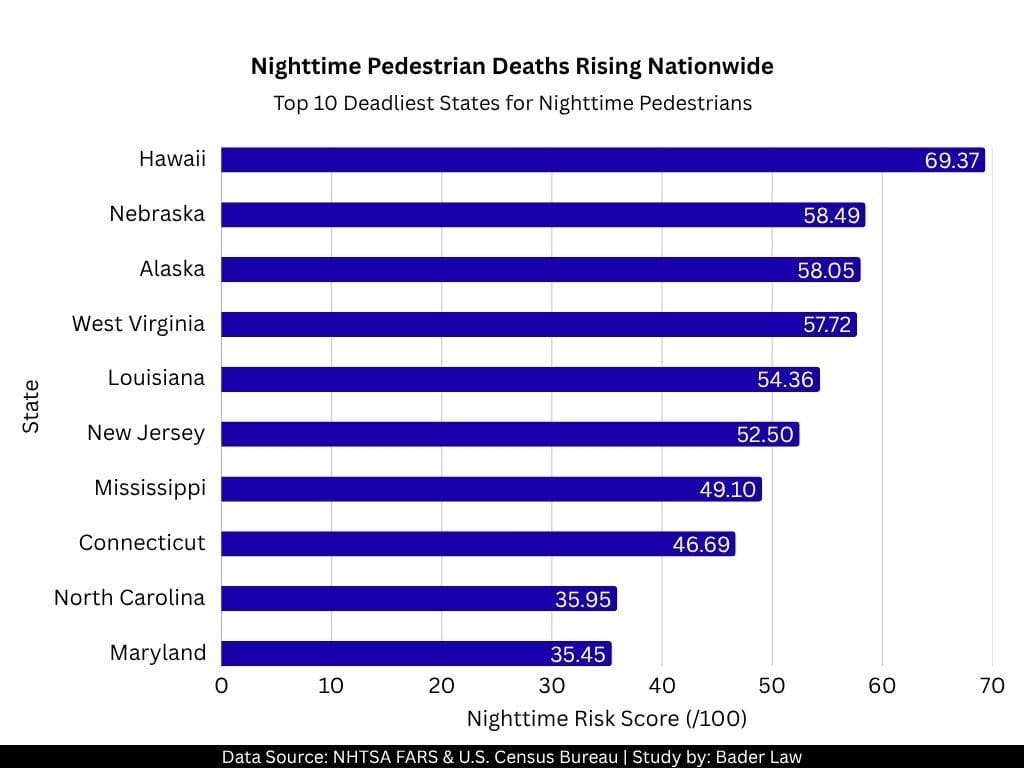
The Deadliest States for Nighttime Pedestrians: National Risk Rankings
Table 1: Top 10 Deadliest States for Nighttime Pedestrians (Composite Risk Score)
| Rank | State | Avg. Annual Fatal Night Crashes(2020-2024) | Fatality Rate per 100K | YoY Change (2023-2024) | Nighttime Risk Score (/100) |
|---|---|---|---|---|---|
| 1 | Hawaii | 20 | 1.39 | +50.00% | 69.37 |
| 2 | Nebraska | 12 | 0.61 | +50.00% | 58.49 |
| 3 | Alaska | 10.8 | 1.47 | +37.50% | 58.05 |
| 4 | West Virginia | 15.6 | 0.88 | +45.45% | 57.72 |
| 5 | Louisiana | 129.2 | 2.80 | +15.18% | 54.36 |
| 6 | New Jersey | 127.8 | 1.37 | +33.33% | 52.50 |
| 7 | Mississippi | 75.4 | 2.56 | +13.33% | 49.10 |
| 8 | Connecticut | 40 | 1.10 | +31.25% | 46.69 |
| 9 | North Carolina | 181 | 1.69 | +12.35% | 35.95 |
| 10 | Maryland | 103.2 | 1.67 | +12.15% | 35.45 |
Key Insight
The highest-ranked states, like Hawaii and Nebraska, combine elevated per-capita fatality rates with sharp year-over-year increases, placing them in a category of both chronic and accelerating danger. Several Northeastern states appear unexpectedly in the top ten, driven entirely by sudden single-year surges that have rapidly changed their national standing.
Where the Risk Is Highest Per Resident: States by Per-Capita Fatality Rate
Table 2: Top 10 States by Nighttime Pedestrian Fatality Rate (per 100,000 Population)
| Rank | State | Avg. Annual Fatal Night Crashes (2020-2024) | Fatality Rate per 100K | YoY Change (2023-2024) | Nighttime Risk Score (/100) |
|---|---|---|---|---|---|
| 1 | New Mexico | 75.8 | 3.58 | -15.91% | 34.09 |
| 2 | Louisiana | 129.2 | 2.80 | +15.18% | 54.36 |
| 3 | South Carolina | 145.4 | 2.75 | -17.88% | 20.52 |
| 4 | Arizona | 198.6 | 2.70 | -3.43% | 34.24 |
| 5 | Florida | 578 | 2.59 | -14.72% | 21.47 |
| 6 | Mississippi | 75.4 | 2.56 | +13.33% | 49.10 |
| 7 | California | 879.8 | 2.24 | -5.78% | 25.56 |
| 8 | Georgia | 241.8 | 2.21 | -12.35% | 18.56 |
| 9 | Nevada | 65.6 | 2.06 | +2.47% | 31.30 |
| 10 | Delaware | 21 | 2.06 | -13.04% | 15.74 |
Key Insight
The states with the highest per-capita rates, like New Mexico and Louisiana, share a common profile: expansive road networks, limited pedestrian infrastructure, and warm climates that sustain year-round foot traffic.
A Region at Risk: How the South Dominates the National Danger Rankings
Table 3: Southern States Ranked by Nighttime Pedestrian Risk Score
| Rank | State | Avg. Annual Fatal Night Crashes (2020-2024) | Fatality Rate per 100K | YoY Change (2023-2024) | Nighttime Risk Score (/100) |
|---|---|---|---|---|---|
| 1 | Louisiana | 129.2 | 2.80 | +15.18% | 54.36 |
| 2 | Mississippi | 75.4 | 2.56 | +13.33% | 49.10 |
| 3 | North Carolina | 181 | 1.69 | +12.35% | 35.95 |
| 4 | Maryland | 103.2 | 1.67 | +12.15% | 35.45 |
| 5 | Alabama | 93 | 1.83 | +7.53% | 33.10 |
| 6 | Arkansas | 59 | 1.94 | -3.33% | 23.71 |
| 7 | South Carolina | 145.4 | 2.75 | -17.88% | 20.52 |
| 8 | Georgia | 241.8 | 2.21 | -12.35% | 18.56 |
| 9 | Tennessee | 133.6 | 1.89 | -13.67% | 12.77 |
| 10 | Oklahoma | 66.2 | 1.65 | -13.24% | 9.75 |
Key Insight
The most dangerous Southern states rank among the highest in the country by both raw fatality volume and per-capita rate, confirming that the region’s pedestrian safety deficit is structural rather than incidental. States that recorded year-over-year declines in 2024 still carry per-capita rates that place them firmly among the nation’s most hazardous.
Where the Problem Is Getting Worse: States With the Steepest Year-Over-Year Surges
Table 4: Top 10 States With the Highest Year-Over-Year Increase in Fatal Nighttime Crashes (2023 to 2024)
| Rank | State | Avg. Annual Fatal Night Crashes (2020-2024) | Fatality Rate per 100K | YoY Change (2023-2024) | Nighttime Risk Score (/100) |
|---|---|---|---|---|---|
| 1 | Hawaii | 20 | 1.39 | +50.00% | 69.37 |
| 2 | Nebraska | 12 | 0.61 | +50.00% | 58.49 |
| 3 | West Virginia | 15.6 | 0.88 | +45.45% | 57.72 |
| 4 | Alaska | 10.8 | 1.47 | +37.50% | 58.05 |
| 5 | New Jersey | 127.8 | 1.37 | +33.33% | 52.50 |
| 6 | Connecticut | 40 | 1.10 | +31.25% | 46.69 |
| 7 | Minnesota | 29.4 | 0.51 | +22.22% | 29.39 |
| 8 | Louisiana | 129.2 | 2.80 | +15.18% | 54.36 |
| 9 | Rhode Island | 6.4 | 0.58 | +14.29% | 22.42 |
| 10 | Mississippi | 75.4 | 2.56 | +13.33% | 49.10 |
Key Insight
The states recording the steepest surges, like Hawaii and Nebraska, span every region of the country, confirming that rapidly worsening nighttime pedestrian safety is a national problem rather than a regional one. Several states in this group had no prior history of ranking among the most dangerous, making their sudden increases a critical signal that demands immediate attention.
Where Progress Is Being Made: The Safest States for Nighttime Pedestrians
Table 5: Top 10 Safest States for Nighttime Pedestrians (Lowest Risk Scores)
| Rank | State | Avg. Annual Fatal Night Crashes (2020-2024) | Fatality Rate per 100K | YoY Change (2023-2024) | Nighttime Risk Score (/100) |
|---|---|---|---|---|---|
| 1 | Wyoming | 4.6 | 0.79 | -75.00% | -63.95 |
| 2 | North Dakota | 5.4 | 0.69 | -66.67% | -57.03 |
| 3 | Idaho | 12 | 0.62 | -58.82% | -50.14 |
| 4 | South Dakota | 9.4 | 1.04 | -58.33% | -43.86 |
| 5 | New Hampshire | 7 | 0.50 | -50.00% | -42.99 |
| 6 | Vermont | 4.8 | 0.74 | -40.00% | -29.62 |
| 7 | Montana | 13 | 1.16 | -43.75% | -27.48 |
| 8 | Kansas | 25.2 | 0.86 | -20.69% | -8.73 |
| 9 | Colorado | 74.4 | 1.27 | -25.26% | -7.50 |
| 10 | Wisconsin | 37.4 | 0.63 | -15.00% | -6.16 |
Key Insight
The safest states, like Wyoming and North Dakota, achieved dramatic year-over-year reductions in 2024, with several recording declines of 50% or more compared to 2023, demonstrating that significant progress is possible within a single year. Lower population density and fewer vehicle miles traveled at night are consistent characteristics among the states with the lowest risk scores.
Methodology
This study analyzed fatal nighttime pedestrian crash records for all 50 U.S. states across a five-year period from 2020 through 2024, sourced from the Fatality Analysis Reporting System (FARS) administered by the National Highway Traffic Safety Administration (NHTSA). Three metrics were calculated for each state: the average annual number of fatal nighttime pedestrian crashes over the study period; a fatality rate per 100,000 population, derived by dividing each state’s average annual fatalities by its five-year average population (sourced from the U.S. Census Bureau) and multiplying by 100,000; and a year-over-year percentage change comparing 2024 fatal crashes to 2023 figures, calculated as (2024 minus 2023) divided by 2023. A composite Nighttime Pedestrian Risk Score out of 100 was then generated using a two-component weighted model: the per-capita fatality rate was normalized onto a 0 to 50 scale, contributing 60% of the total score, while the year-over-year percentage change was normalized onto a negative 50 to positive 50 scale, contributing the remaining 40%. The two component scores were summed to produce each state’s final risk score, with states ranked in descending order, where higher scores indicate greater nighttime pedestrian danger.
Data Sources
Fatality Analysis Reporting System (FARS), National Highway Traffic Safety Administration (NHTSA): https://cdan.dot.gov/query
U.S. Census Bureau, Population Estimates by State: https://data.census.gov/table?q=population+by+age+by+state
Research Dataset: https://docs.google.com/spreadsheets/d/16jbPaCoqaKyUkyo_AGQsDU3PVbFFaxW7AXWRfDKvnZY/edit?gid=0#gid=0
Study by: https://www.baderlaw.com
About Bader Law
Bader Law is a Georgia-based personal injury and workers’ compensation law firm that has recovered more than $350 million for injured clients. The firm is committed to public safety awareness and regularly publishes data-driven research to highlight preventable risks facing communities across the United States. Learn more at baderlaw.com.