
Your Car Isn’t Safe Everywhere: A 60-Point Risk Gap Separates America’s Most and Least Dangerous States for Car Owners
Key Takeaways
- Deadliest State: New Mexico is the only state to rank in the top 6 across all three risk categories, 4th in vehicle theft (441 per 100,000), 6th in break-ins (400 per 100,000), and 3rd in fatal crashes (19 per 100,000), earning the nation’s highest risk score of 80.
- Regional Divide: 7 of the 10 riskiest states sit west of the Mississippi River, while all five safest states, New York, Massachusetts, New Hampshire, New Jersey, and Maine, are concentrated in the Northeast.
- Safest State: New York ranks as America’s safest state with a score of just 20, driven by the nation’s lowest fatal crash rate (5 per 100,000) and second-lowest break-in rate (76 per 100,000).
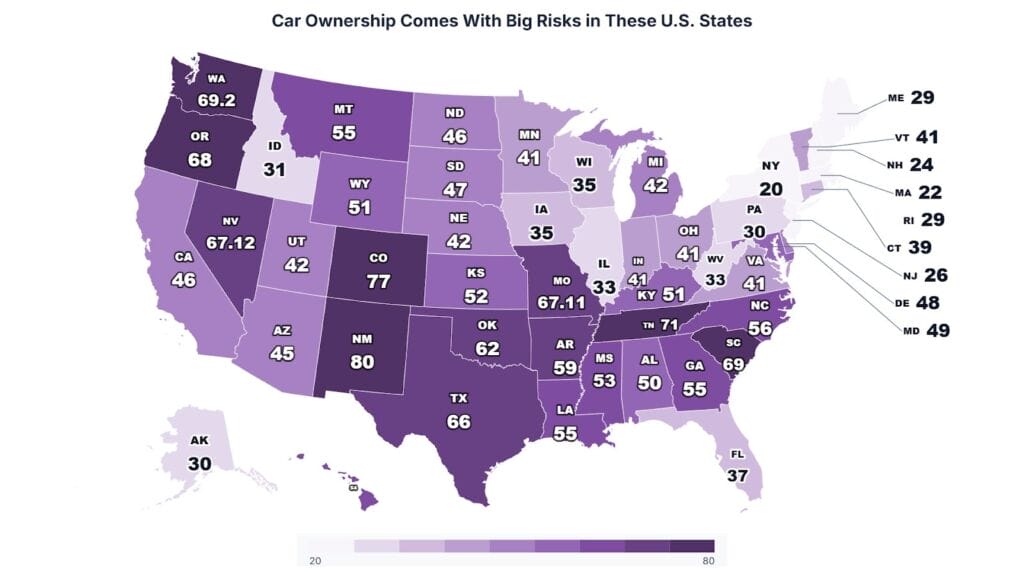
A car owner moving from New York to New Mexico doesn’t just change zip codes; they quadruple their risk. New Mexico’s car ownership risk score of 80/100 towers over New York’s 20/100, a 60-point chasm that reveals just how dramatically vehicle safety varies across state lines.
The study, conducted by H&P Law, analyzed motor vehicle theft data (2021–2025), theft from motor vehicle incidents (2021–2025), and fatal vehicle crash statistics (2019–2023) across all 50 states. Per-capita rates were calculated and combined into a weighted Car Ownership Risk Score, with fatal crashes weighted at 50 points, vehicle theft at 30 points, and break-ins at 20 points.
LEARN MORE: Palo District at former Fiesta Mall site in Mesa gets 2 new hotels
FOOD NEWS: 25 places for great patio dining in Arizona
The Riskiest States for Car Ownership in America
The Car Ownership Risk Score combines three critical metrics normalized per 100,000 population: Motor Vehicle Theft, Vehicle Break-ins, and Fatal Crashes to identify which states pose the greatest overall risk to vehicle owners.
Table 1: 10 Riskiest States for Car Ownership
| Rank | State | Risk Score (0-100) | Motor Vehicle Theft Rate | Break-In Rate | Fatal Crash Rate |
| 1 | New Mexico | 80 | 441 | 400 | 19 |
| 2 | Colorado | 77 | 585 | 469 | 11 |
| 3 | Tennessee | 71 | 336 | 401 | 17 |
| 4 | Washington | 69.2 | 483 | 507 | 8 |
| 5 | South Carolina | 69 | 230 | 384 | 19 |
| 6 | Oregon | 68 | 383 | 446 | 12 |
| 7 | Nevada | 67.12 | 488 | 384 | 11 |
| 8 | Missouri | 67.11 | 405 | 335 | 15 |
| 9 | Texas | 66 | 322 | 443 | 13 |
| 10 | Oklahoma | 62 | 275 | 334 | 16 |
New Mexico earns the top spot by ranking in the top tier across all three categories: 4th in vehicle theft, 6th in break-ins, and 3rd in fatal crashes. Seven of the ten riskiest states are located west of the Mississippi River, revealing a clear geographic concentration of risk.
Looking at the study, a spokesperson from H&P Law commented:
“These findings underscore how dramatically car ownership risks vary across state lines. A driver relocating from New York to New Mexico faces four times the combined risk of vehicle theft, break-ins, and fatal crashes. Understanding these geographic disparities helps vehicle owners make informed decisions about insurance coverage and safety precautions.”
The Safest States for Car Ownership
While some states present elevated risks across multiple categories, others offer vehicle owners substantially greater protection.
Table 2: 10 Safest States for Car Ownership
| Rank | State | Risk Score (0-100) | Motor Vehicle Theft Rate | Break-In Rate | Fatal Crash Rate |
| 50 | New York | 20 | 122 | 76 | 5 |
| 49 | Massachusetts | 22 | 97 | 131 | 5 |
| 48 | New Hampshire | 24 | 63 | 110 | 8 |
| 47 | New Jersey | 26 | 142 | 121 | 6 |
| 46 | Rhode Island | 29 | 132 | 205 | 5 |
| 45 | Maine | 29 | 69 | 109 | 11 |
| 44 | Pennsylvania | 30 | 173 | 99 | 8 |
| 43 | Alaska | 30 | 216 | 65 | 8 |
| 42 | Idaho | 31 | 74 | 107 | 11 |
| 41 | West Virginia | 33 | 82 | 71 | 14 |
The Northeast region claims all five of the safest positions, with the top five averaging a combined risk score of just 24.2 compared to 73.2 for the riskiest five. New Hampshire records the nation’s lowest motor vehicle theft rate at 63 per 100,000, 9.3 times lower than Colorado’s leading rate of 585.
States With the Highest Motor Vehicle Theft Rates
Vehicle theft represents a 30-point component of the overall risk score.
Table 3: Top 10 States by Motor Vehicle Theft Rate
| Rank | State | Thefts per 100,000 Residents | Average Annual Thefts |
| 1 | Colorado | 585 | 34,534 |
| 2 | Nevada | 488 | 15,702 |
| 3 | Washington | 483 | 38,019 |
| 4 | New Mexico | 441 | 9,364 |
| 5 | Missouri | 405 | 25,178 |
| 6 | Oregon | 383 | 16,291 |
| 7 | Hawaii | 368 | 5,303 |
| 8 | Tennessee | 336 | 23,995 |
| 9 | California | 334 | 131,104 |
| 10 | Maryland | 323 | 20,082 |
Colorado’s theft rate of 585 per 100,000 is 9.3 times higher than New Hampshire’s nation-low rate of 63, the widest gap between any two states.
States With the Highest Fatal Vehicle Crash Rates
Fatal crashes carry the heaviest weight in the risk calculation at 50 points, reflecting their irreversible impact.
Table 4: Top 10 States by Fatal Crash Rate
| Rank | State | Fatal Crashes per 100,000 Residents | Average Annual Fatal Crashes |
| 1 | Mississippi | 22 | 654 |
| 2 | Wyoming | 20 | 115 |
| 3 | South Carolina | 19 | 1,000 |
| 4 | New Mexico | 19 | 397 |
| 5 | Arkansas | 19 | 564 |
| 6 | Alabama | 17 | 880 |
| 7 | Montana | 17 | 192 |
| 8 | Louisiana | 17 | 787 |
| 9 | Tennessee | 17 | 1,164 |
| 10 | Kentucky | 16 | 714 |
Mississippi’s fatal crash rate of 22 per 100,000 is 4.4 times higher than rates in Massachusetts, New York, and Rhode Island (5 per 100,000 each).
States With the Highest Vehicle Break-In Rates
Theft from motor vehicles contributes 20 points to the overall risk score.
Table 5: Top 10 States by Vehicle Break-In Rate
| Rank | State | Break-Ins per 100,000 Residents | Average Annual Break-Ins |
| 1 | Washington | 507 | 39,896 |
| 2 | Colorado | 469 | 27,686 |
| 3 | Oregon | 446 | 19,001 |
| 4 | Texas | 443 | 135,793 |
| 5 | Tennessee | 401 | 28,612 |
| 6 | New Mexico | 400 | 8,493 |
| 6 | Hawaii | 400 | 5,773 |
| 8 | Nevada | 384 | 12,365 |
| 8 | South Carolina | 384 | 20,634 |
| 10 | North Carolina | 343 | 37,278 |
Washington State’s break-in rate of 507 per 100,000 is 7.8 times higher than Alaska’s national low rate of 65 per 100,000. The Pacific Northwest claims three of the top four positions, with Washington, Colorado, and Oregon forming a regional cluster of elevated break-in risk.
Methodology
This analysis examined three core metrics across all 50 U.S. states: average annual motor vehicle thefts (2021–2025), average annual theft from motor vehicles/break-ins (2021–2025), and average annual fatal vehicle crashes (2019–2023). Each metric was converted into a per-capita rate (per 100,000 residents), normalized, and weighted into a 100-point composite index: 30 points for theft, 30 points for break-ins, and 40 points for fatal crashes.
Data Source
- Vehicle Crash Data: https://cdan.dot.gov/query
- Vehicle Theft Data: https://cde.ucr.cjis.gov/
- Research Dataset: https://docs.google.com/spreadsheets/d/1f3BPqi8kyVL3Kkb4KImPMUmcmTuUWj0O05zp1BsbZ0M/edit?gid=0#gid=0
- Study by: https://courtroomproven.com/
About H&P Law
H&P Law is an experienced personal injury law firm dedicated to protecting clients’ rights and maximizing claim value.