
4 States Trap 1 in 5 Immigrants in Extreme Poverty, Exposing America’s Immigrant Divide
KEY FINDINGS
• Connecticut records 71.1% of foreign-born residents in moderate poverty , more than 2.38 times higher than second-ranked Arkansas (29.8%) driving the state to the nation’s worst Immigrant Poverty Index score of 86.1.
• Southern states dominate immigrant poverty rankings, claiming six of the top 10 positions.
• New Hampshire offers the best economic outcomes for foreign-born residents nationwide, with just 14.8% in moderate poverty and 7.5% in extreme poverty, the lowest in the nation.
In New Hampshire, 7.5% of foreign-born residents live below the federal poverty line—the lowest rate in the nation. In Connecticut, 71.1% remain trapped in moderate poverty, earning too much to qualify for assistance yet too little to achieve financial stability. These two states, separated by just 150 miles, occupy opposite ends of a 56.4-point divide in immigrant economic outcomes. The disparity is not incidental; it reflects structural differences in labor markets, cost of living, and policy environments that shape whether foreign-born residents build wealth or struggle to survive.
This analysis by The Mendoza Law Firm ranks all 50 U.S. states using an Immigrant Poverty Index (0-100 scale). The index combines extreme poverty rates (below 100% of federal poverty level, weighted at 60 points) and moderate poverty rates (100-199% of poverty level, weighted at 40 points), drawing on Migration Policy Institute data from the U.S. Census Bureau’s American Community Survey. Higher scores indicate worse outcomes.
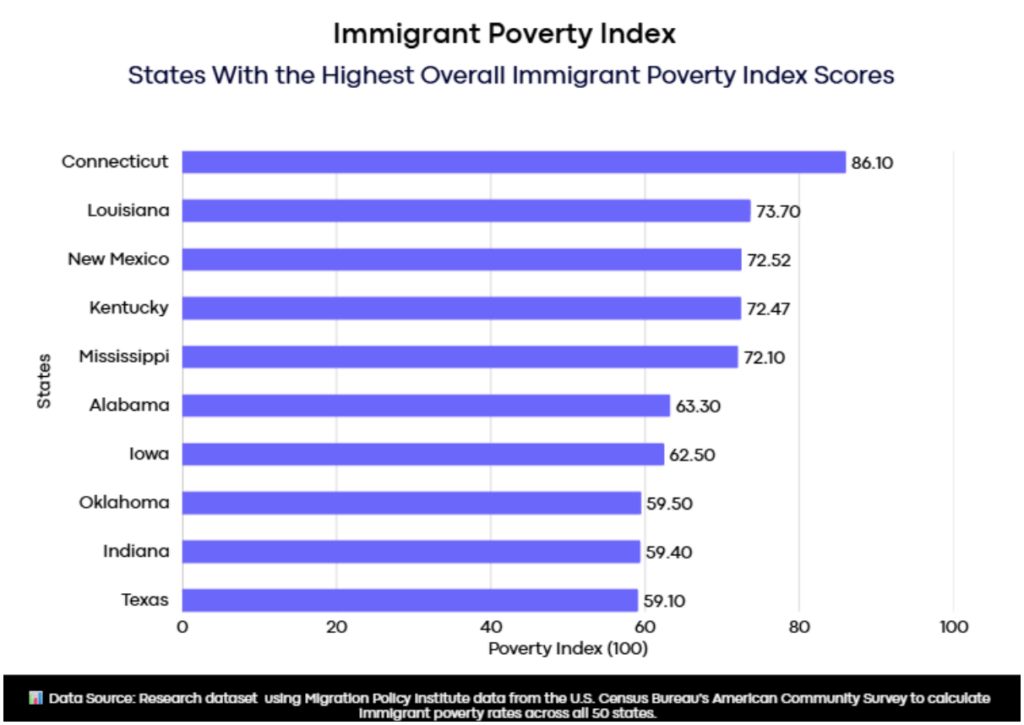
States With the Highest Overall Immigrant Poverty Index Scores
| Rank | State | Extreme Poverty (%) | Moderate Poverty (%) | Poverty Index (100) |
| 1 | Connecticut | 16.2 | 71.1 | 86.1 |
| 2 | Louisiana | 20.7 | 26.4 | 73.7 |
| 3 | New Mexico | 20.4 | 25.8 | 72.52 |
| 4 | Kentucky | 20.6 | 24.7 | 72.47 |
| 5 | Mississippi | 21.1 | 21.5 | 72.1 |
| 6 | Alabama | 18.4 | 19.5 | 63.3 |
| 7 | Iowa | 17.2 | 24.2 | 62.5 |
| 8 | Oklahoma | 16.2 | 23.9 | 59.5 |
| 9 | Indiana | 16.4 | 22.7 | 59.4 |
| 10 | Texas | 16.6 | 21.2 | 59.1 |
| 11 | Michigan | 17.2 | 17.7 | 58.9 |
| 12 | North Dakota | 17.3 | 17.1 | 58.8 |
| 13 | Ohio | 16.8 | 19.2 | 58.6 |
| 14 | Tennessee | 16.4 | 20.5 | 58.2 |
| 15 | Idaho | 15.9 | 22.6 | 57.9 |
The top-ranked state’s index score of 86.1 exceeds the second-ranked state by 12.4 points, driven by an unprecedented 71.1% moderate poverty rate. Six Southern states appear in the top 10, establishing a clear regional pattern of elevated immigrant economic hardship.
States With the Highest Extreme Poverty Rates Among Foreign-Born Residents
| Extreme Poverty Rank | State | Below 100% Poverty (%) | Overall Index Rank |
| 15 | Oklahoma | 16.2 | 8 |
| 14 | Connecticut | 16.2 | 1 |
| 13 | New York | 16.4 | 16 |
| 12 | Tennessee | 16.4 | 14 |
| 11 | Indiana | 16.4 | 9 |
| 10 | Texas | 16.6 | 10 |
| 9 | Ohio | 16.8 | 13 |
| 8 | Michigan | 17.2 | 11 |
| 7 | Iowa | 17.2 | 7 |
| 6 | North Dakota | 17.3 | 12 |
| 5 | Alabama | 18.4 | 6 |
| 4 | New Mexico | 20.4 | 3 |
| 3 | Kentucky | 20.6 | 4 |
| 2 | Louisiana | 20.7 | 2 |
| 1 | Mississippi | 21.1 | 5 |
Four states exceed the 20% threshold, meaning more than one in five foreign-born residents live below the federal poverty line. The top-ranked state’s 21.1% rate is nearly triple the national low of 7.5%.
States With the Highest Moderate Poverty Rates Among Foreign-Born Residents
| Rank | State | 100-199% Poverty (%) | Overall Index Rank |
| 15 | South Carolina | 21.1 | 17 |
| 14 | Texas | 21.2 | 10 |
| 13 | Nebraska | 21.2 | 18 |
| 12 | Mississippi | 21.5 | 5 |
| 11 | North Carolina | 21.5 | 27 |
| 10 | Idaho | 22.6 | 15 |
| 9 | Indiana | 22.7 | 9 |
| 8 | Oklahoma | 23.9 | 8 |
| 7 | Iowa | 24.2 | 7 |
| 6 | Kentucky | 24.7 | 4 |
| 5 | South Dakota | 25.0 | 29 |
| 4 | New Mexico | 25.8 | 3 |
| 3 | Louisiana | 26.4 | 2 |
| 2 | Arkansas | 29.8 | 26 |
| 1 | Connecticut | 71.1 | 1 |
The top-ranked state’s 71.1% moderate poverty rate exceeds the second-ranked state by 41.3 percentage points, a gap larger than the entire spread of extreme poverty rates nationwide. This concentration traps nearly three-quarters of foreign-born residents in economic vulnerability.
States With the Lowest Immigrant Poverty Index Scores
| Rank | State | Extreme Poverty (%) | Moderate Poverty (%) | Poverty Index |
| 50 | New Hampshire | 7.5 | 14.8 | 29.7 |
| 49 | Alaska | 9.2 | 17.1 | 35.8 |
| 48 | Virginia | 10.2 | 15.0 | 37.4 |
| 47 | Hawaii | 10.7 | 12.7 | 37.6 |
| 46 | Maryland | 10.2 | 15.9 | 37.9 |
| 45 | New Jersey | 11.0 | 15.5 | 40.0 |
| 44 | Washington | 11.3 | 14.0 | 40.0 |
| 43 | Vermont | 11.7 | 12.2 | 40.1 |
| 42 | Montana | 12.4 | 15.6 | 44.0 |
| 41 | Colorado | 12.7 | 14.3 | 44.2 |
The best-performing state records just 7.5% extreme poverty and an index score of 29.7 , more than half the national median. All top 10 performers maintain moderate poverty rates below 18%, demonstrating achievable benchmarks for immigrant economic integration.
Complete State Rankings by Immigrant Poverty Index
| Rank | State | Extreme Poverty (%) | Moderate Poverty (%) | Poverty Index |
| 1 | Connecticut | 16.2 | 71.1 | 86.1 |
| 2 | Louisiana | 20.7 | 26.4 | 73.7 |
| 3 | New Mexico | 20.4 | 25.8 | 72.52 |
| 4 | Kentucky | 20.6 | 24.7 | 72.47 |
| 5 | Mississippi | 21.1 | 21.5 | 72.1 |
| 6 | Alabama | 18.4 | 19.5 | 63.3 |
| 7 | Iowa | 17.2 | 24.2 | 62.5 |
| 8 | Oklahoma | 16.2 | 23.9 | 59.5 |
| 9 | Indiana | 16.4 | 22.7 | 59.4 |
| 10 | Texas | 16.6 | 21.2 | 59.1 |
| 11 | Michigan | 17.2 | 17.7 | 58.9 |
| 12 | North Dakota | 17.3 | 17.1 | 58.8 |
| 13 | Ohio | 16.8 | 19.2 | 58.6 |
| 14 | Tennessee | 16.4 | 20.5 | 58.2 |
| 15 | Idaho | 15.9 | 22.6 | 57.9 |
| 16 | New York | 16.4 | 18.3 | 56.9 |
| 17 | South Carolina | 15.5 | 21.1 | 55.9 |
| 18 | Nebraska | 15.3 | 21.2 | 55.4 |
| 19 | Arizona | 15.4 | 20.4 | 55.3 |
| 20 | Kansas | 15.4 | 20.2 | 55.2 |
| 21 | Pennsylvania | 15.4 | 17.4 | 53.6 |
| 22 | Utah | 15.4 | 17.2 | 53.5 |
| 23 | Florida | 14.7 | 20.2 | 53.2 |
| 24 | West Virginia | 15.3 | 16.8 | 53.0 |
| 25 | Wisconsin | 14.6 | 19.2 | 52.3 |
| 26 | Arkansas | 12.5 | 29.8 | 52.3 |
| 27 | North Carolina | 13.6 | 21.5 | 50.8 |
| 28 | Missouri | 13.7 | 20.0 | 50.2 |
| 29 | South Dakota | 12.5 | 25.0 | 49.6 |
| 30 | Wyoming | 14.0 | 16.7 | 49.2 |
| 31 | Rhode Island | 13.4 | 19.6 | 49.1 |
| 32 | Minnesota | 13.8 | 17.5 | 49.1 |
| 33 | Georgia | 13.2 | 19.2 | 48.3 |
| 34 | Maine | 13.6 | 16.6 | 48.0 |
| 35 | Delaware | 13.7 | 15.2 | 47.5 |
| 36 | Massachusetts | 13.8 | 14.5 | 47.4 |
| 37 | California | 13.0 | 18.3 | 47.3 |
| 38 | Oregon | 12.8 | 18.2 | 46.6 |
| 39 | Illinois | 12.7 | 17.1 | 45.7 |
| 40 | Nevada | 12.0 | 20.3 | 45.5 |
| 41 | Colorado | 12.7 | 14.3 | 44.2 |
| 42 | Montana | 12.4 | 15.6 | 44.0 |
| 43 | Vermont | 11.7 | 12.2 | 40.1 |
| 44 | Washington | 11.3 | 14.0 | 40.0 |
| 45 | New Jersey | 11.0 | 15.5 | 40.0 |
| 46 | Maryland | 10.2 | 15.9 | 37.9 |
| 47 | Hawaii | 10.7 | 12.7 | 37.6 |
| 48 | Virginia | 10.2 | 15.0 | 37.4 |
| 49 | Alaska | 9.2 | 17.1 | 35.8 |
| 50 | New Hampshire | 7.5 | 14.8 | 29.7 |
The complete rankings reveal a 56.4-point spread from worst to best, with scores clustering between 45 and 60 for the majority of states.
Methodology
The Immigrant Poverty Index ranks all 50 U.S. states on a 0-100 scale using Migration Policy Institute data from the U.S. Census Bureau’s American Community Survey. The index combines extreme poverty rates (foreign-born residents below 100% of the federal poverty level, weighted at 60 points) and moderate poverty rates (100-199% of poverty level, weighted at 40 points). Each state’s percentage is normalized against the national high—Mississippi’s 21.1% for extreme poverty and Connecticut’s 71.1% for moderate poverty, with higher scores indicating worse economic outcomes for foreign-born residents.
Data Sources
State Income Data: https://www.migrationpolicy.org/data/state-profiles/state/income/MN
Research Dataset: https://docs.google.com/spreadsheets/d/1DCzhNSt_wVBgAa6u8hj_n9aMeRYrtYIeQazuutMW_u4/edit?usp=sharing
Study By: https://mendozafirm.com
About The Mendoza Law Firm
The Mendoza Law Firm provides legal services in immigration law, personal injury, and international professional recruitment for U.S. companies seeking qualified professionals from abroad. The firm advocates for immigrant communities through legal representation and public education initiatives.