KEY HIGHLIGHTS
- Weather conditions contributed to 41,879 fatal crashes nationwide over five years, averaging 23 fatal crashes per day.
- Montana leads the nation with a weather-related fatal crash rate 7.7 times higher than the safest state, Rhode Island.
- Seven of the 10 most dangerous states are in the South, where ice storms and unfamiliar winter conditions catch drivers off guard.
It starts with rain on a windshield and ends with flashing lights on the shoulder. Somewhere in America, this scene repeats 23 times a day. Over five years, weather-related conditions contributed to 41,879 fatal crashes nationwide, but the danger doesn’t fall equally. Some states are seven times deadlier than others when the sky turns hostile.
According to an analysis by Ace Law Group, which examined five years of federal crash data (2019 through 2023) from the National Highway Traffic Safety Administration’s Fatality Analysis Reporting System (FARS). By calculating weather-related fatal crash rates per 100,000 residents, the study reveals which states pose the greatest risk when conditions deteriorate.
READ MORE: TSMC Arizona: A look inside the $165 billion site
GET THE LATEST NEWS: Subscribe for free to get AZ Big Media’s newsletter
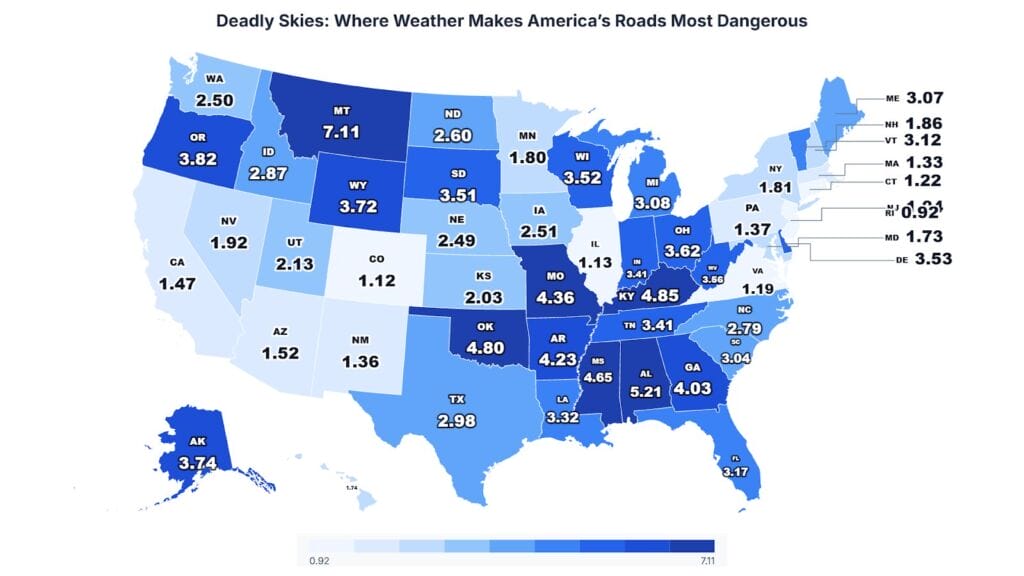
Montana Tops Nation with Weather-Related Fatal Crash Rate 7.7 Times Higher Than Safest State
Table 1: Top 10 States with Highest Weather-Related Fatal Crash Rates
| Rank | State | Annual Avg. Fatal Crashes (2019 to 2023) | Rate Per 100,000 Residents |
| 1 | Montana | 78.4 | 7.11 |
| 2 | Alabama | 262.0 | 5.21 |
| 3 | Kentucky | 218.4 | 4.85 |
| 4 | Oklahoma | 192.0 | 4.80 |
| 5 | Mississippi | 137.2 | 4.65 |
| 6 | Missouri | 268.6 | 4.36 |
| 7 | Arkansas | 128.2 | 4.23 |
| 8 | Georgia | 436.0 | 4.03 |
| 9 | Oregon | 161.8 | 3.82 |
| 10 | Alaska | 27.4 | 3.74 |
Montana’s rate of 7.11 weather-related fatal crashes per 100,000 residents is nearly three times the national average of 2.53. The state’s combination of rural highways, extreme winter conditions, and limited emergency response infrastructure may contribute to this elevated risk.
Looking at the study, a spokesperson from Ace Law Group commented
These findings underscore that weather-related crashes are not random acts of nature but preventable tragedies. Drivers in high-risk states must recognize that familiar roads become fundamentally different in adverse conditions. Reducing speed, increasing following distance, and knowing when to stay home can save lives.”
Rhode Island Ranks as Nation’s Safest State for Weather-Related Crashes
Table 2: Top 10 Safest States (Lowest Weather-Related Fatal Crash Rates)
| Nat’l Rank | State | Annual Avg. Fatal Crashes (2019 to 2023) | Rate Per 100,000 Residents |
| 50 | Rhode Island | 10.0 | 0.92 |
| 49 | New Jersey | 95.4 | 1.04 |
| 48 | Colorado | 65.4 | 1.12 |
| 47 | Illinois | 143.0 | 1.13 |
| 46 | Virginia | 103.0 | 1.19 |
| 45 | Connecticut | 43.8 | 1.22 |
| 44 | Massachusetts | 92.6 | 1.33 |
| 43 | New Mexico | 28.8 | 1.36 |
| 42 | Pennsylvania | 177.4 | 1.37 |
| 41 | California | 576.6 | 1.47 |
The safest states share common characteristics: denser road networks with shorter distances between emergency services, experienced winter driving populations, and robust snow removal infrastructure. Rhode Island’s rate of 0.92 per 100,000 is 64% below the national average.
Texas Leads in Total Crashes, but Population Size Skews Raw Numbers
Table 3: Top 10 States by Total Weather-Related Fatal Crashes (Raw Numbers, 2019 to 2023)
| Rank | State | Total Weather-Related Fatal Crashes (2019 to 2023) |
| 1 | Texas | 4,422 |
| 2 | Florida | 3,475 |
| 3 | California | 2,883 |
| 4 | Georgia | 2,180 |
| 5 | Ohio | 2,128 |
| 6 | New York | 1,788 |
| 7 | Michigan | 1,546 |
| 8 | North Carolina | 1,479 |
| 9 | Missouri | 1,343 |
| 10 | Alabama | 1,310 |
While Texas recorded the highest total number of weather-related fatal crashes (4,422), its per capita rate of 2.98 per 100,000 ranks only 25th nationally. Population size significantly influences raw crash totals, making per capita rates a more accurate measure of relative risk.
28 States Exceed National Average for Weather-Related Fatal Crash Rate
More than half of U.S. states (28 of 50) have weather-related fatal crash rates exceeding the national average of 2.53 per 100,000 residents.
Table 4: States Exceeding National Average (Ranked by Rate)
| Rank | State | Rate | Rank | State | Rate |
| 1 | Montana | 7.11 | 15 | Wisconsin | 3.52 |
| 2 | Alabama | 5.21 | 16 | South Dakota | 3.51 |
| 3 | Kentucky | 4.85 | 17 | Indiana | 3.41 |
| 4 | Oklahoma | 4.80 | 18 | Tennessee | 3.41 |
| 5 | Mississippi | 4.65 | 19 | Louisiana | 3.32 |
| 6 | Missouri | 4.36 | 20 | Florida | 3.17 |
| 7 | Arkansas | 4.23 | 21 | Vermont | 3.12 |
| 8 | Georgia | 4.03 | 22 | Michigan | 3.08 |
| 9 | Oregon | 3.82 | 23 | Maine | 3.07 |
| 10 | Alaska | 3.74 | 24 | South Carolina | 3.04 |
| 11 | Wyoming | 3.72 | 25 | Texas | 2.98 |
| 12 | Ohio | 3.62 | 26 | Idaho | 2.87 |
| 13 | West Virginia | 3.56 | 27 | North Carolina | 2.79 |
| 14 | Delaware | 3.53 | 28 | North Dakota | 2.60 |
The national average rate is 2.53 weather-related fatal crashes per 100,000 residents. States listed above range from 2.60 (North Dakota) to 7.11 (Montana), with all exceeding this benchmark.
Methodology
This analysis utilized data from the National Highway Traffic Safety Administration’s Fatality Analysis Reporting System (FARS), accessed via the CDAN Query Tool. Fatal crash records were extracted for the years 2019 through 2023, then filtered to isolate crashes occurring under hazardous weather conditions, including rain, mist, sleet, hail, freezing rain or drizzle, snow, fog, smog, smoke, and combined rain and fog conditions. Total weather-related fatal crashes were aggregated by state, with five-year totals and annual averages calculated to minimize year-over-year volatility. Crash figures were normalized per 100,000 residents using U.S. Census Bureau population estimates (five-year average). All 50 states were then ranked from highest to lowest based on weather-related fatal crash rate per 100,000 residents.
Data Sources
- NHTSA Fatality Analysis Reporting System (FARS) via CDAN Query Tool – https://cdan.dot.gov/query
- Research Dataset: https://docs.google.com/spreadsheets/d/1Wboia2dsNk87pKBhtuFwK2eGyrcorAeykwA7q0SFkcI/edit?gid=0#gid=0
- Research by: http://acelawgroup.com/
About Ace Law Group
The study was conducted by Ace Law Group, a Las Vegas–based personal injury law firm representing injured individuals throughout Nevada. The firm handles car accidents, commercial vehicle crashes, premises liability claims, and serious injury cases, with a proven record of securing substantial verdicts and settlements for clients.
For more information, visit acelawgroup.com.