Spring Road Trip Alert: Riskiest U.S. States Revealed
| Key Highlights • Mississippi ranks #1 out of 50 states with a Spring Road Trip Risk Score of 78 out of 100, driven by the nation’s highest spring fatal crash rate of 18 per 100,000 residents and 29.85% of roads in unacceptable condition. • Rhode Island has the worst road infrastructure in the country, with 44.75% of roads in unacceptable condition, yet it ranks only 8th overall because its per-capita fatal crash rate is just 4 per 100,000. • Vermont is the safest state for spring road trips with a score of just 28 out of 100, nearly three times lower than Mississippi’s 78, the widest gap in overall risk between any two states. |
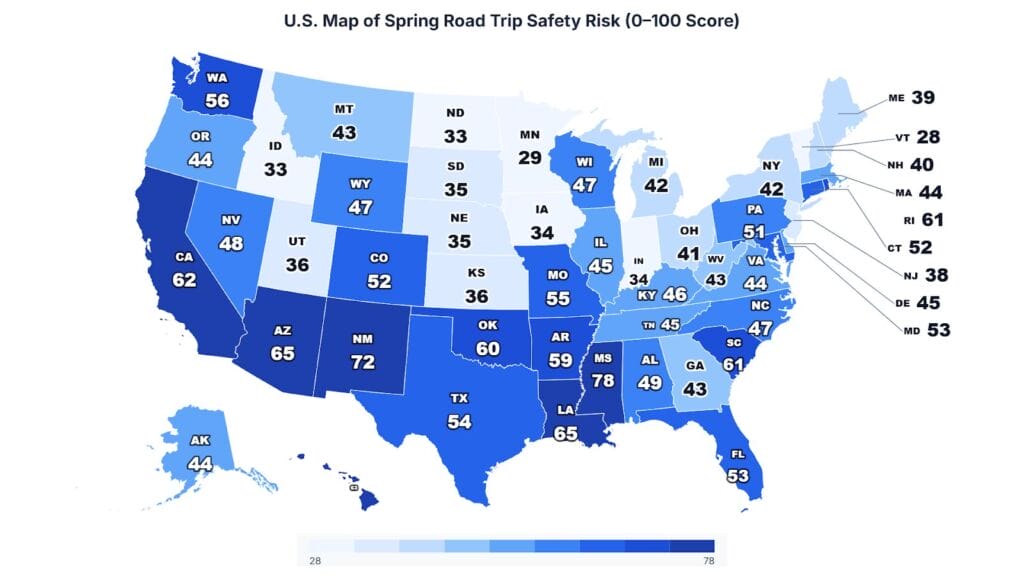
As millions of Americans gear up for spring road trips, a new study uncovers stark disparities in road safety across all 50 states. From crumbling pavement and deadly crash rates to surging gas prices, some states pose far greater risks for drivers this season than others.
This study was conducted by Wilk Law Personal Injury & Car Accident Lawyers using federal road safety, infrastructure, and fuel price data. All 50 states were scored on a 100-point scale across three weighted indicators: fatal road crashes during March and April per 100,000 residents (40 points), percentage of roads in unacceptable condition (40 points), and average gasoline price per gallon (20 points). States are ranked by their overall Spring Road Trip Risk Score.
Top 10 Riskiest States for Spring Road Trips by Overall Risk Score
| Rank | State | Fatal Crashes Per 100K | Unacceptable Roads % | Gas Price/Gal | Risk Score (100) |
| 1 | Mississippi | 18 | 29.85% | $3.05 | 78 |
| 2 | New Mexico | 13 | 32.97% | $3.42 | 72 |
| 3 | Louisiana | 14 | 25.97% | $3.11 | 65 |
| 4 | Arizona | 12 | 25.75% | $3.97 | 65 |
| 5 | Hawaii | 5 | 39.09% | $4.59 | 63 |
| 6 | California | 7 | 28.04% | $5.29 | 62 |
| 7 | South Carolina | 14 | 19.50% | $3.21 | 61 |
| 8 | Rhode Island | 4 | 44.75% | $3.40 | 61 |
| 9 | Oklahoma | 11 | 26.88% | $3.01 | 60 |
| 10 | Arkansas | 14 | 17.43% | $3.05 | 59 |
Mississippi leads the nation with a combined risk score of 78 out of 100, six points ahead of second-place New Mexico, making it the clear outlier among all 50 states. Seven of the top 10 riskiest states are in the South or Southwest, where high fatal crash rates and deteriorating road conditions converge to create acute spring travel hazards. Notably, Hawaii and Rhode Island earn top-10 rankings despite relatively low crash rates because their severely degraded road infrastructure drives up their overall scores.
Looking at the study, Tyler Wilk, Founder of Wilk Law Personal Injury & Car Accident Lawyers, commented:
“These rankings expose a reality most travelers never consider before hitting the road each spring. When a state like Mississippi records 18 fatal crashes per 100,000 residents in just two months while nearly a third of its roads are in unacceptable condition, that is not just a data point—it is a warning. Every driver deserves to know the risks before planning a route, and every state has a responsibility to invest in the infrastructure and enforcement that keeps people alive.”
States With the Highest Spring Fatal Crash Rates Per 100,000 Residents
| Rank | State | Population (2023) | Total Fatal Crashes (Mar–Apr, 2019–2023) | Fatal Crashes Per 100K |
| 1 | Mississippi | 2,939,690 | 531 | 18 |
| 2 | South Carolina | 5,373,555 | 774 | 14 |
| 2 | Arkansas | 3,067,732 | 443 | 14 |
| 2 | Louisiana | 4,573,749 | 623 | 14 |
| 2 | Wyoming | 584,057 | 79 | 14 |
| 6 | New Mexico | 2,114,371 | 285 | 13 |
| 6 | Alabama | 5,108,468 | 677 | 13 |
| 6 | Florida | 22,610,726 | 2,839 | 13 |
| 9 | Arizona | 7,431,344 | 904 | 12 |
| 9 | Tennessee | 7,126,489 | 885 | 12 |
Mississippi’s spring fatal crash rate of 18 per 100,000 is nearly 30% higher than the four states tied for second place at 14, underscoring just how far it outpaces the rest of the country on this single metric. Texas records the highest raw crash total at 2,923, followed by California at 2,901 and Florida at 2,839, yet its massive population of over 30.5 million dilutes the per-capita rate to 10. Wyoming’s appearance at 14 per 100,000 from just 79 total crashes highlights how small populations amplify individual risk.
States With the Worst Road Infrastructure by Percentage of Unacceptable Roads
| Rank | State | % Unacceptable Roads | Road Condition Score (40) | Overall Risk Score (100) |
| 1 | Rhode Island | 44.75% | 40 | 61 |
| 2 | Hawaii | 39.09% | 35 | 63 |
| 3 | New Mexico | 32.97% | 29 | 72 |
| 4 | Connecticut | 29.97% | 27 | 52 |
| 5 | Mississippi | 29.85% | 27 | 78 |
| 6 | Washington | 29.63% | 26 | 56 |
| 7 | Maryland | 28.72% | 26 | 53 |
| 8 | California | 28.04% | 25 | 62 |
| 9 | Pennsylvania | 27.37% | 24 | 51 |
| 10 | Oklahoma | 26.88% | 24 | 60 |
Rhode Island’s 44.75% unacceptable road rate is the highest in the nation, more than 5 percentage points above second-place Hawaii at 39.09%, earning it a perfect 40 out of 40 on the road condition component. Six of these 10 states also appear in the overall top 10 riskiest rankings, confirming that poor road infrastructure is a strong predictor of elevated spring travel risk. Connecticut and Pennsylvania rank in the worst 10 for road conditions but fall outside the top 10 overall, suggesting their lower crash rates partially offset their infrastructure deficits.
States With the Highest Average Gasoline Prices Per Gallon
| Rank | State | Avg Gas Price/Gal | Gas Price Score (20) | Overall Risk Score (100) |
| 1 | California | $5.29 | 20 | 62 |
| 2 | Washington | $4.69 | 18 | 56 |
| 3 | Hawaii | $4.59 | 17 | 63 |
| 4 | Nevada | $4.30 | 16 | 48 |
| 5 | Oregon | $4.26 | 16 | 44 |
California’s average gas price of $5.29 per gallon is the highest in the country, 60 cents more than second-place Washington at $4.69, and earns it a perfect 20 out of 20 on the fuel cost component. All five of the most expensive states for gasoline are located in the western United States or the Pacific, reflecting regional refining and tax structures that disproportionately burden spring road trippers in those areas.
Safest States for Spring Road Trips by Overall Risk Score
| Rank | State | Fatal Crashes Per 100K | Unacceptable Roads % | Gas Price/Gal | Risk Score (100) |
| 50 | Vermont | 5 | 5.15% | $3.44 | 28 |
| 49 | Minnesota | 4 | 9.46% | $3.26 | 29 |
| 48 | Idaho | 7 | 6.23% | $3.41 | 33 |
| 47 | North Dakota | 7 | 6.67% | $3.08 | 33 |
| 46 | Iowa | 6 | 8.74% | $3.19 | 34 |
| 45 | Indiana | 8 | 2.62% | $3.49 | 34 |
| 44 | South Dakota | 8 | 4.90% | $3.10 | 35 |
| 43 | Nebraska | 7 | 7.39% | $3.15 | 35 |
| 42 | Kansas | 10 | 3.81% | $2.96 | 36 |
| 41 | Utah | 6 | 11.32% | $3.40 | 36 |
Vermont earns the lowest risk score in the nation at just 28 out of 100, nearly three times lower than Mississippi’s 78, making it the safest state for spring road trips by a comfortable margin. Seven of the 10 safest states are in the Midwest, where moderate crash rates, well-maintained roads, and affordable gas prices combine to create the most favorable driving conditions. Indiana stands out with just 2.62% of roads in unacceptable condition, the lowest rate of any state in the entire study.
Methodology
This study analyzed all 50 U.S. states across three weighted indicators: average annual fatal road crashes during March and April per 100,000 residents from 2019 to 2023 (40 points), percentage of roads classified as being in unacceptable condition (40 points), and average gasoline price per gallon (20 points). Each state was assigned a Spring Road Trip Risk Score out of 100 based on these indicators. States were then ranked by their composite score to identify where drivers face the greatest challenges during peak spring travel season.
Data Sources
- AAA State Gas Price Averages: https://gasprices.aaa.com/state-gas-price-averages/
- CDAN Query Tool: https://cdan.dot.gov/query
- Bureau of Transportation Statistics – Road Condition: https://www.bts.gov/road-condition
- Research Dataset: https://docs.google.com/spreadsheets/d/1KHinzCDrTGFGZ9TXwgBm5lP6BNZ1E_rDm25CoXYljvc/edit?gid=0#gid=0
- Study By: https://wilklawfirm.com/
About Wilk Law Personal Injury & Car Accident Lawyers
Wilk Law Personal Injury & Car Accident Lawyers is a Pennsylvania-based personal injury firm representing injured individuals and their families exclusively, with no representation of insurance companies or corporate defendants. The firm publishes road safety research as part of its ongoing commitment to public awareness and advocacy for crash victims and their families. Learn more at wilklawfirm.com