The Sun Belt is leading the charge for buyer’s markets. So, what is the best housing market for buyers in Arizona and where do Arizona homebuyers have the most leverage?
MORE NEWS: Home down payments hit lowest level since 2021
ConsumerAffairs analyzed housing market data for over 6,000 ZIP codes across the U.S. to determine where homebuyers and sellers hold the most negotiating power.
Wickenburg’s 85390 ZIP code is home to Arizona’s strongest buyer’s market.
- From April to June of 2026, just 2.4% of homes sold above list price — that’s far below the national average of 23.5%.
- On average, homes in 85390 sell for just 95% of the asking price. Across America, homes typically sell for 98% of the asking price.
- In this part of Wickenburg, homes spend a median of 118 days on the market — almost double the national median of 60 days. For buyers, that can mean more time to shop and greater negotiating power.
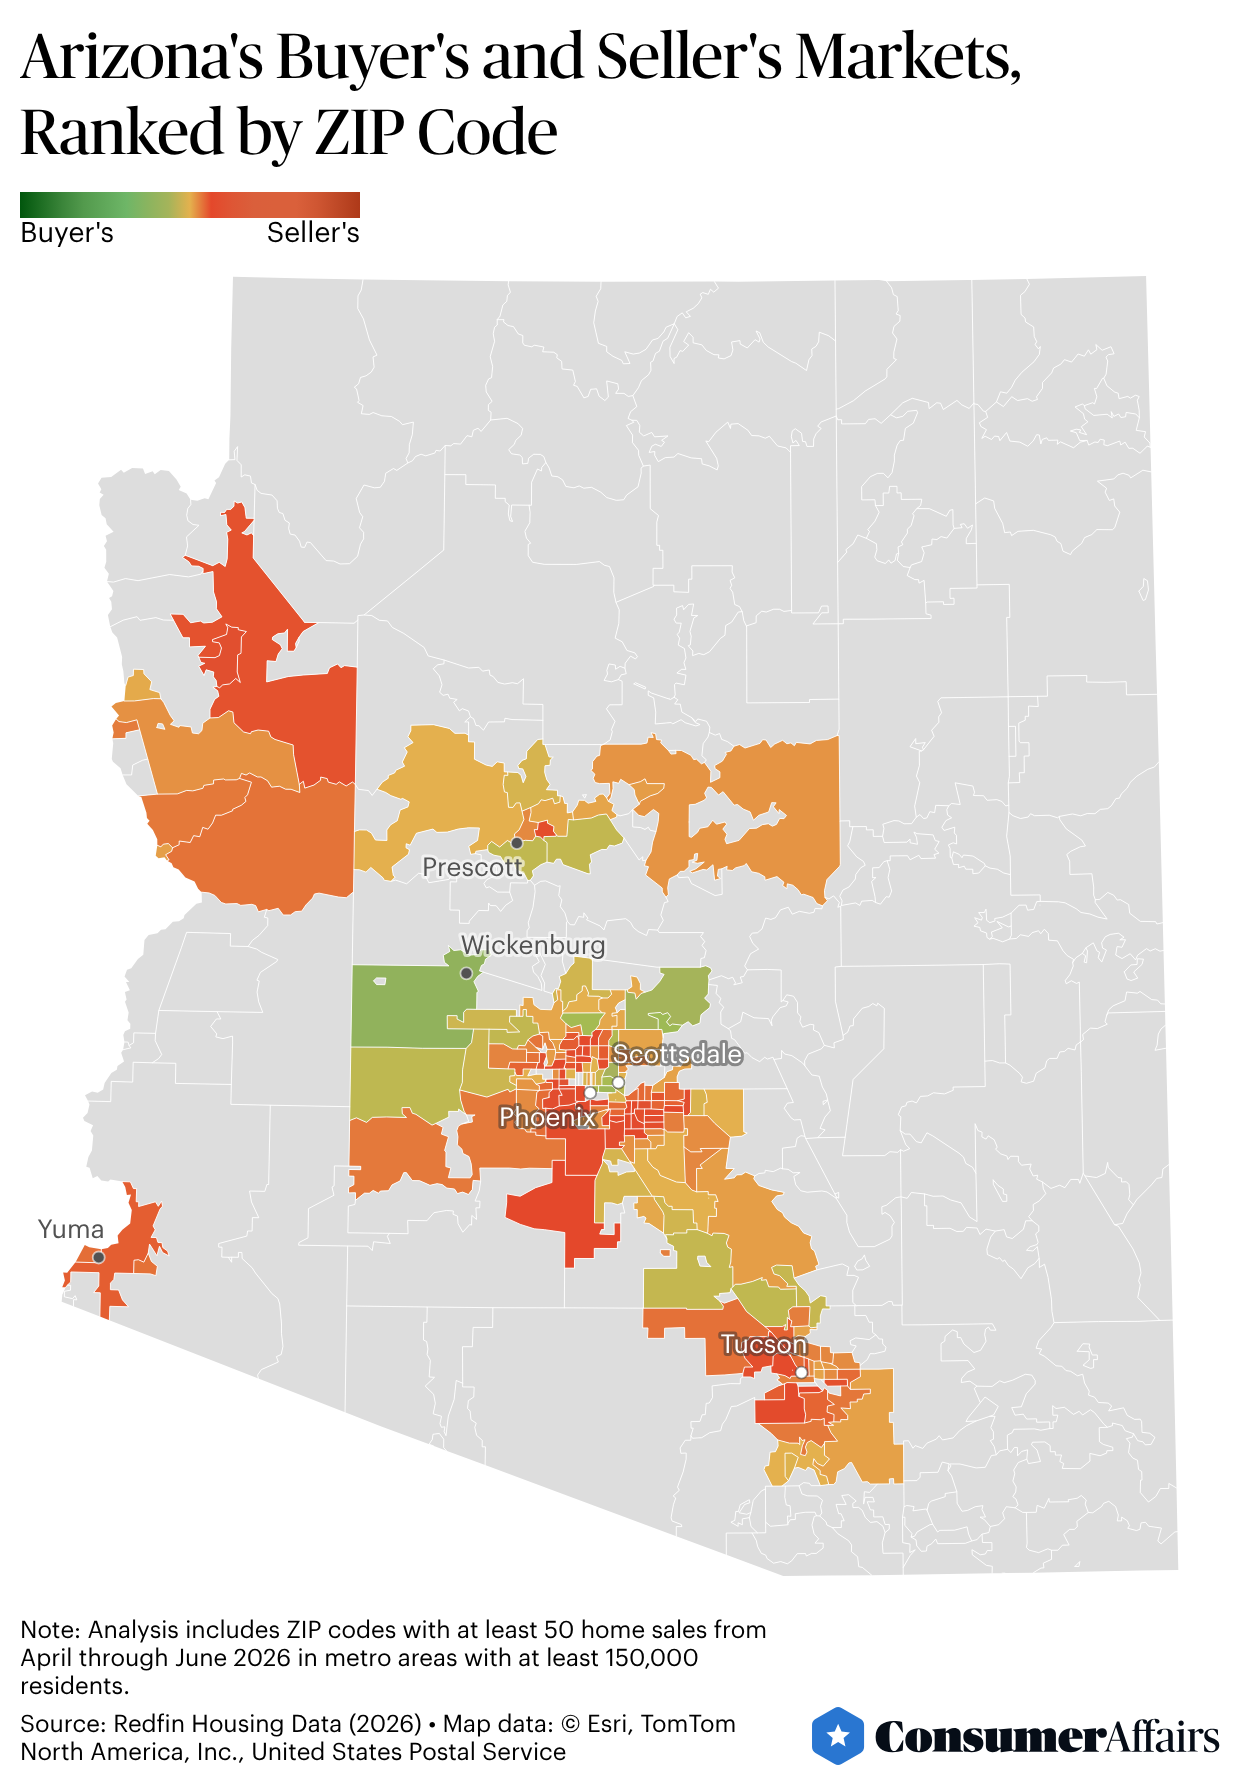
Peak homebuying season may bring a nationwide flurry of activity, but the housing market is hardly moving in one direction. In some places, buyers have more room to browse, negotiate and wait. In others, homes are disappearing almost as soon as they hit the market. Increasingly, your negotiating power comes down to your ZIP code. Whether you’re a first-time buyer or a seasoned investor, understanding local housing supply and demand is one of the essential steps to buying a house successfully.
To see where buyers or sellers have the upper hand, ConsumerAffairs ranked 6,291 ZIP codes with at least 50 homes sales from April through June 2026 in metro areas with at least 150,000 residents. We used five Redfin housing metrics, including months of housing supply, sale-price-to-list-price ratio, share of homes sold above list price, median days on market and share of listings with price drops, to identify the strongest buyer’s and seller’s markets and the areas in between.
Where are the most balanced housing markets?
If a local housing market is a tug-of-war, a balanced market is where buyers and sellers are pulling with roughly equal force and neither side has a clear advantage in negotiations. In our scoring system, a score of 50 out of 100 best represents the midpoint between buyer and seller friendliness.
The data shows that these balanced ZIP codes have around four to seven months of housing supply and sale-to-list ratios near 97% to 98%, meaning the average home sells just below the list price. The share of homes selling above list price is below the national average of 23.5%, and the percentage of listings that undergo price drops is mostly above the U.S. average of 31.6%. The median number of days on market is variable, ranging from 40 to 83.
These balanced ZIP codes are also geographically diverse, covering all regions except the Midwest.
The following ZIP codes are essentially balanced between buyer- and seller-friendly conditions:
- Coolidge, Arizona (85228)
- Denton, Texas (76208)
- Staten Island, New York (10301)
- Philadelphia, Pennsylvania (19123 and 19134)
- Spartanburg, South Carolina (29302)
- Green Valley, Arizona (85614)
- Rio Vista, California (94571)
- Rowlett, Texas (75089)
- Charlotte, North Carolina (28206)
- Phoenix, Arizona (85014)