
ATTOM Data Solutions, curator of the nation’s premier property database and first property data provider of Data-as-a-Service (DaaS), today released its First-Quarter 2020 U.S. Home Sales Report, which shows that home sellers nationwide realized a home price gain of $67,100 on the typical sale, up from $66,264 in the fourth quarter of 2019 and up from $59,000 in the first quarter of last year.
That $67,100 typical home-seller profit represented a 33.7 percent return on investment compared to the original purchase price, down from the post-recession high of 34.4 percent in the fourth quarter of 2019 but up from 32.8 percent a year ago.
At the same time, the median price for single-family homes and condominiums rose to a new high of $265,900 in the first quarter of 2020, up 2.9 percent quarterly and 11.3 percent year-over-year. The annual increase was the largest since the third quarter of 2013.
“The national housing market continued at full throttle in the first quarter of 2020, setting new price and profit records as it entered its ninth straight year of gains. After it looked like things were settling down last year, the market has again roared ahead, with significant increases,” said Todd Teta, chief product officer at ATTOM Data Solutions. “It is extremely important to note that the latest momentum is likely to hit a wall and reverse because of the drastic economic slowdown caused by the Coronavirus pandemic. Millions of Americans are newly unemployed, and most people are practicing social distancing, which could bring things to a halt just as the Spring buying season begins. Despite that cloud, the numbers for Q1 still do remain upbeat.”
Among 108 metropolitan statistical areas with at least 1,000 single-family home and condo sales in the first quarter of 2020, those in western states continued to reap the highest returns on investment, with concentrations on or near the west coast. Metro areas with the highest home seller ROIs were in San Jose, CA (81.8 percent); San Francisco, CA (67.7 percent); Seattle, WA (63.6 percent); Spokane, WA (61.8 percent) and Boise, ID (59.1 percent).
Boise and Milwaukee lead major metros in home price appreciation
The U.S. median home price increased annually 11.3 percent in the first quarter of 2020, hitting a new high of $265,900. The annual home-price appreciation in the first quarter far surpassed the 2.8 percent annual gain in the first quarter of 2019 and the 7.6 annual gain the first quarter of 2018.
Among metropolitan statistical areas with at least 1,000 single-family home and condo sales in the first quarter of 2020, the biggest year-over-year increases in median home prices were in Boise, ID (up 21.9 percent); Milwaukee, WI (up 19.1 percent); Panama City, FL (up 18.4 percent); Salisbury, MD (up 15.4 percent) and New Orleans, LA (up 13.9 percent).
Along with Milwaukee and New Orleans, other major metro areas with a population of at least 1 million and at least a 10 percent annual increase in home prices in the first quarter of 2020 were Virginia Beach, VA (up 13.0 percent); Phoenix, AZ (up 12.1 percent); Memphis, TN (up 11.5 percent); Columbus, OH (up 11.4 percent) and Charlotte, NC (up 10.7 percent).
Home prices in the first quarter of 2020 hit new peaks in 17 of the 108 metros (16 percent), including Los Angeles, CA; Phoenix, AZ; San Diego, CA; Orlando, FL and Portland, OR.
U.S. Historical Median Home Sales Prices
Homeownership tenure remains near record high nationwide, but down in many areas
Homeowners who sold in the first quarter of 2020 had owned their homes an average of 8.01 years, down slightly from 8.04 years in the previous quarter but up from 7.72 years in the first quarter of 2019.
Among 107 metro areas analyzed with sufficient data, Connecticut metro areas continued to dominate the top five tenures for home sellers in the first quarter of 2020: Bridgeport (13.25 years), Torrington (13.0 years), Norwich (12.9 years), New Haven (12.51 years) and Hartford (12.04 years).
Average U.S. Homeownership Tenure (Years)
Counter to the national annual trend, 41 of the 107 metro areas in the report (38 percent) posted a year-over-year decrease in average home-seller tenure, including Rockford, IL (down 9.0 percent); Kahului, HI (down 8.2 percent); Santa Cruz, CA (down 6.9 percent); Salt Lake City, UT (down 5.9 percent) and Colorado Springs, CO (down 4.9 percent).
A quarter of home buyers made all-cash purchases in the first quarter of 2020
Nationwide, all-cash purchases accounted for 26.6 percent of single-family home and condo sales in the first quarter of 2020, up from 25.6 percent in the fourth quarter of 2019 but down from 27.4 percent in the first quarter of 2019, and well off the 43.0 percent level recorded in the first quarter of 2011. However, the latest figure still exceeds pre-recession levels of 15 to 25 percent between 2000 and 2007.
Among 158 metropolitan statistical areas with a population of at least 200,000 and sufficient cash-sales data, those where cash sales represented the largest share of all transactions in the first quarter of 2020 were Naples, FL (56.5 percent of sales); Macon, GA (56.2 percent); Montgomery, AL (55.0 percent); Cape Coral, FL (45.9 percent) and Huntington, WV (45.8 percent).
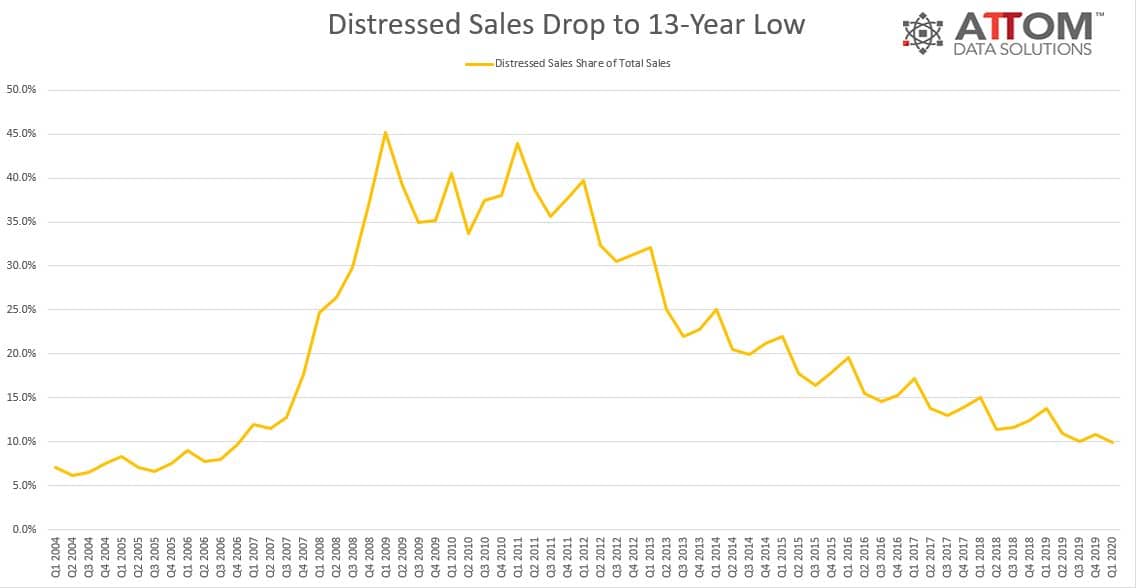
U.S. distressed sales at 13-year low
Distressed home sales — including bank-owned (REO) sales, third-party foreclosure auction sales and short sales — accounted for 9.9 percent of all U.S. single-family home and condo sales in the first quarter of 2020, down from 10.8 percent in the prior quarter and from 13.8 percent a year earlier. The latest figure marked the lowest point since the fourth quarter of 2006 and is only about one-fifth of the peak level of 45.2 percent in first quarter of 2009.
Among 107 metropolitan statistical areas with a population of at least 200,000 and with sufficient data, those where distressed sales represented the largest portion of all sales in the first quarter of 2020 were New Haven, CT (23.2 percent of sales); Norwich, CT (22.9 percent of sales); Peoria, IL (22.5 percent of sales); Hartford, CT (22 percent of sales) and Atlantic City, NJ (21.8 percent of sales).
U.S. Historical Distressed Sales
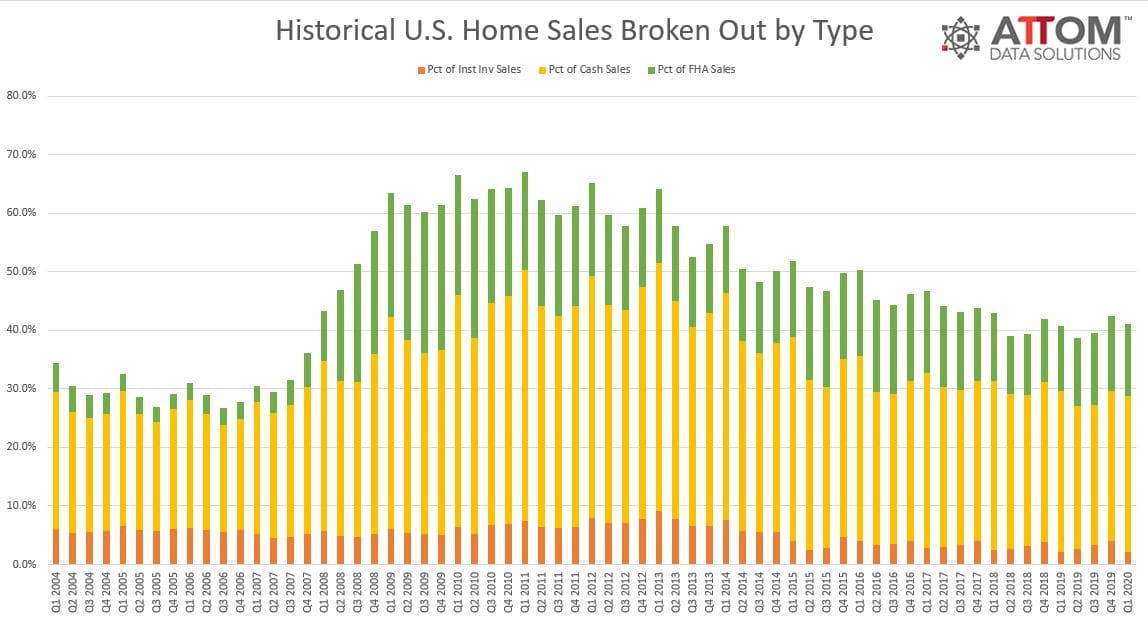
Institutional investment sales drop significantly
Institutional investors nationwide accounted for 2.2 percent of all single-family home and condo sales in the first quarter of 2020, down from 4.1 percent in the fourth quarter of 2019 to the lowest point since at least 2000.
States with the highest levels of sales by institutional investors in the first quarter of 2020 were Georgia (6.9 percent of sales), North Carolina (5.4 percent), Arizona (5.1 percent), Nevada (4.6 percent) and Alabama (3.3 percent).
Historical U.S. Home Sales Broken Out by Type
Texas and California metro areas dominate list with the highest levels of FHA loans
Nationwide, buyers using Federal Housing Administration (FHA) loans accounted for 12.3 percent of all single-family home and condo purchases in the first quarter of 2020, down from 12.8 percent in the previous quarter but up from 11.1 percent a year earlier.
Among 165 metropolitan statistical areas with a population of at least 200,000 and sufficient FHA- buyer data, those with the highest levels of FHA buyers in the first quarter of 2020 were McAllen, TX (28.9 percent of sales); Visalia, CA (28.4 percent); Yuma, AZ (26.9 percent); Modesto, CA (26.7 percent) and Corpus Christi, TX (25.9 percent).


