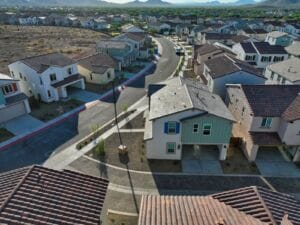
Despite delivering 22,952 new apartment units from 2011 to 2016, demand vastly exceeded supply by approximately 7,100 units; if based on 2016/17 population estimates which saw Maricopa rank No. 1 in the country in population growth, the deficit rises to approximately 12,000 now and 18,000 by 2020.
In fact, if Medium Range Growth Projections are used, a more likely scenario given Maricopa’s status as fastest growing county in the nation, unit delivery deficit will increase to 20,000+ over the time period. As a result, by 2020, the Occupancy Rate for the Phoenix MSA, barring any unexpected increases in current construction levels, is forecasted to reach an all-time high of approximately 96 percent.
A recent report shows that there is a long-term deficit with the number of available apartments, with the Phoenix area needing 150,302 new apartments by 2030 to meet demand
As one LinkedIn user lamented on all of Scottsdale’s new multifamily development, “our unofficial bird is now the Crane.” Given all the market chatter about overheated multifamily construction, both inside and outside of commercial real estate circles, I felt it prudent to dig a bit deeper into the actual data and metrics of apartment unit construction and the results were, in a word, surprising.
This analysis is meant to provide a very top-level view of apartment market demand and makes no assertions as to quality/type of build, simply focuses on the actual units that are/will be needed/delivered. In order to streamline the analysis process, the following assumptions were made:
- Population Data is based on Census and Arizona Department of Administration’s Low Series Maricopa County Current Population & Projections (2015 to 2050) and is based only on Population Growth of the 20 to 74-year-old demographic segment
- Average Household (HH) Size is based off Census estimates and internal ABI projections as follows: 2010/11=2.67, from 2012 to 2020 average household size is increased to 2.75
- Renter Household (HH) Percentage is based off Census estimates and internal ABI projections as follows: for 2010 is 33.1 percent, 2011=34.8 percent, 2012=36.2 percent, 2013=37.5 percent, 2014=38.7 percent, 2015=39.3 percent, 2016=40.0 percent (est), 2017=40.5 percent (est), 2018=41.0 percent (est), 2019=41.5 percent (est) and 2020=42 percent (est).
- Units Deliveries for 2017/18 are based on projects currently Under Construction as of 2Q 2017 (17,197 units, 50+ unit properties) with delivery expected by end of 2018. For 2019/20, projects currently Under Construction with deliveries set through 2020 + assuming that 40 percent (4,851 units) of all Planned units as of 2Q 2017 (12,310) will be completed by 2020 as well.
- Occupancy Rate is based off actuals (source Yardi) and internal ABI projections as follows: 2011=92.2 percent, 2012=92.9 percent, 2013=92.8 percent, 2014=93.8 percent, 2015=94.8 percent, 2016=95.3 percent, 2017=95 percent (est), 2018=94.7 percent (est), 2019=95.3 percent (est), 2020=96% (est) percent
Phoenix Market Metrics: By the Numbers
The MSA’s total sales volume (10+ unit properties) decreased (29 percent), year-over-year, to $1.29 billion across 93 transactions representing 10,694 total units sold. California-based investors continue to be the dominant buyer of multifamily properties in the Valley accounting for 31 percent of total units transacted or 3,292 units, Arizona-based investors came in 2nd with a little over 2,000 units purchased and, rounding out the top five: (No. 3) Pacific Northwest-investors with 1,213 units purchase, (No. 4) Canadian investors with 1,188 units and (No. 5) Utah-based investors with 659 units.
Sales of 100+ unit properties witnessed the greatest sales volume contraction decreasing (33 percent) year-over-year to $1.13B. Despite volume contraction, average price per unit amount increased approximately 14 percent to $125,058. Whereas 100+ unit properties saw sales volume decrease, 10 to 99-unit properties saw its volume increase 27 percent to $153.8M with a surge of 35 percent in average price-per-unit amounts to $93,297. Price-per-unit increases in the smaller property size category dovetails the sales trend which began in earnest in late 2016 through 1Q 2017, as mid-century built, extensively repositioned properties having been coming back online for sale. In fact, pre-1980’s built product represented 84 percent of all transactions in the 2Q.
The Phoenix MSA experienced a (39 percent) year-over-year decrease in 2Q 2017 unit deliveries with 1,620 new units delivered to the market. Nonetheless, Phoenix MSA developers are on track to deliver 7,500+ new units by the end of 2017. Despite elevated unit deliveries occupancy rates for the MSA contracted slightly, (0.6 percent), to 95 percent while average rent increased 5.3 percent to a market record $1,000. City of Phoenix and Mesa claimed the top spots in the MSA for rent growth at 5.5 percent respectively, followed by Tempe at 5.4 percent, Glendale at 4.8 percent and Scottsdale at 4.4 percent. Although Scottsdale saw the lowest average rental rate percentage increase of the MSA, it still claims the top spot in actual average rent which at $1,291 is the highest in the region.
Outlook
I firmly stick behind my 2017 Market Forecast, despite Fed chatter and three 25-50bps increases behind us, it is unlikely the Fed will continue with its gradual interest rate increase for the balance of 2017 despite many economists predicting otherwise. Basis for this sentiment is rooted in two primary areas, namely weak inflationary pressures, as stated by Yellen, and continued sub-3 percent GDP growth post-recession. This isn’t to say that we are without headwinds; in fact, given government stasis in key legislative areas, specifically healthcare and tax reform, has resulted in loss of the ‘Trump bounce’ yet people remain largely optimistic. Additionally, despite the projected end to gradual interest rate increases, the Fed has made statements it wants to move towards ‘balance sheet reduction’ or QT, quantitative tightening, which certainly has the potential to sap liquidity from the market. Internationally there is still significant instability in both EM (Emerging) and DM (Developed) markets, particularly across Europe and Asia. It’s helpful to remember some 50%+ of the world’s developed markets continue to operate at zero or below interest rates which has led to capital flight. Despite stocks hitting all-time highs, based in large part on investors factoring in massive deregulation, markets the world over have been prone to ever increasing volatility fits.
For more national/international investors, the Phoenix MSA has long been perceived as a more secondary market when compared to the ‘gateway’ markets of Los Angeles, San Francisco, Seattle, New York etc. Beginning in late 2015, amidst the run-up in prices in more coastal regions, investors turned toward more interior-core markets such as Denver and Phoenix in which to find value and yield. Given Phoenix’s current business maturation, i.e. from one focused primarily on construction to the Silicon Desert and major financial services/insurance/aerospace/transportation hub, coupled with Maricopa County’s ascension to top spot in population growth, will continue to propel the Phoenix MSA now and into the foreseeable future.
Listen to Thomas Brophy’s podcast about this quarter’s report here.