
The COVID-19 pandemic has made migration a hot topic for all states. Which states will benefit the most from increased remote work? We will not have hard data to answer that question for a while, but now is a good time to revisit a key migration dataset to see how things stood before the outbreak began and to see which states send the most new residents to Arizona. (For additional perspective, we refer you to our article “Destination Arizona: Where are People Moving From? And Why?” from Sept. 2020.)
According to the latest Census five-year estimates covering the 2015-2019 period, Arizona drew 266,648 migrants from other U.S. states each year. That estimate counts only those moving to the state and does not include those moving out. The Phoenix MSA (Maricopa and Pinal counties) drew 171,706 migrants and the Tucson MSA drew 37.937.
READ ALSO: Phoenix is No. 1 in U.S. for population growth by numbers
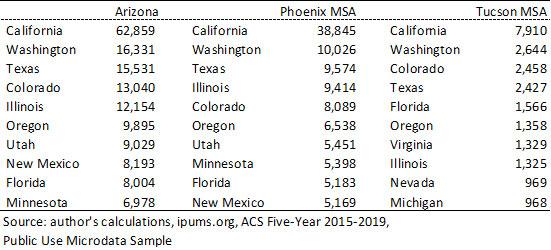
Among U.S. states, Arizona drew the by far the most migrants from California, followed by Washington, Texas, Colorado, and Illinois (Exhibit 1). California alone accounted for 23.6% of all people moving to the state during the period.
California also sent by far the most migrants of any state to the Phoenix MSA (Maricopa and Pinal counties), followed by Washington, Texas, Illinois, and Colorado. The Tucson MSA also received the most migrants from California, followed by Washington, Colorado, Texas, and Florida. California migrants accounted for 22.6% of the total for Phoenix and 20.9% for Tucson.
EXHIBIT 1: ANNUAL GROSS MIGRATION FLOWS INTO REGION BY STATE OF RESIDENCE ONE YEAR AGO, TOP TEN STATES, ACS FIVE-YEAR ESTIMATES, 2015-2019
Arizona drew the most migrants from states in the West Census region, which sent 137,054 people to the state (Exhibit 2 and Exhibit 3). That was 51.4% of total movers. The Midwest and South sent similar numbers of migrants to the state, at 55,754 (20.9%) and 55,627 (20.9%), respectively. The Northeast sent 18,213 migrants or 6.8% of total movers.
EXHIBIT 2: ANNUAL GROSS MIGRATION FLOWS INTO REGION BY STATE OF RESIDENCE ONE YEAR AGO, CENSUS REGION TOTALS, ACS FIVE-YEAR ESTIMATES, 2015-2019
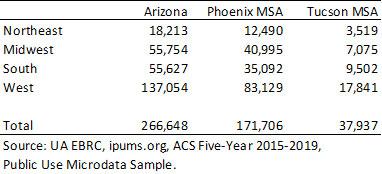
EXHIBIT 3: ARIZONA DREW RESIDENTS FROM ALL OVER THE NATION, BUT MANY COME FROM WESTERN STATES
Phoenix also drew the most migrants from states in the West Census region, which sent 83,129 people to the metropolitan area (Exhibit 2 and Exhibit 4). That was 48.4% of total movers. The Midwest sent the next largest number (40,995 or 23.9%), followed by the South (35,092, or 20.4%) and the Northeast (12,490, or 7.3%).
EXHIBIT 4: GROSS MIGRATION TO THE PHOENIX MSA, ACS FIVE-YEAR ESTIMATES, 2015-2019
Similarly, Tucson drew the most migrants from states in the West Census region, which sent 17,841 people to the metropolitan area (Exhibit 2 and Exhibit 5). That was 47.0% of total movers. The South sent the next largest number (9,502 or 25.0%), followed by the Midwest (7.075, or 18.6%) and the Northeast (3,519, or 9.3%).
EXHIBIT 5: GROSS MIGRATION TO THE TUCSON MSA, ACS FIVE-YEAR ESTIMATES, 2015-2019
Exhibit 6 shows gross migration flows to Arizona, Phoenix, and Tucson by state of residence one year ago.
EXHIBIT 6: GROSS MIGRATION FLOWS FROM U.S. STATES TO ARIZONA, PHOENIX, AND TUCSON, ACS FIVE-YEAR ESTIMATES, 2015-2019
Migration to Arizona and Major Metros 2015-2019

George W. Hammond, Ph.D., is the director and research professor at the Economic and Business Research Center (EBRC).