Media monitoring counts mentions, reach and sentiment, and it does that well. What it cannot do is tell you whether anybody put the magazine down and went to your website, because no clipping service can follow a reader from a printed page into a browser.
That gap is not a flaw in the tools. It is a structural limit of measuring publication rather than behaviour, and it is why a coverage report can show a strong month while the commercial team sees nothing move. A QR Code closes part of that gap, because a scan is an action somebody took rather than an audience figure somebody estimated.
Five specific blind spots are worth understanding, and each one is anchored below to a tool that addresses it. Prices for four were checked on 25 July 2026, and Bitly was checked on 23 August 2026.
What media monitoring actually measures
Three things, and all three are properties of the coverage rather than of the reader.
Volume is the first, meaning how many pieces mentioned you across a period. Reach is the second, usually derived from a publication’s circulation or audience figure, which is an estimate of how many people could have seen the piece rather than how many did. Sentiment is the third, a judgement about tone, produced either by a model or by an analyst.
Every one of those is measured at the point of publication. Nothing in that chain observes what a reader did next, and the standard workaround is to look for a traffic spike on the day of coverage and attribute it by proximity. That works when one thing happens at a time, and almost nothing happens at a time.
The gap between an impression and an action
An impression is an estimate of opportunity, whereas an action is a record of behaviour, and the difference between them is the entire argument for putting a code in a press pack.
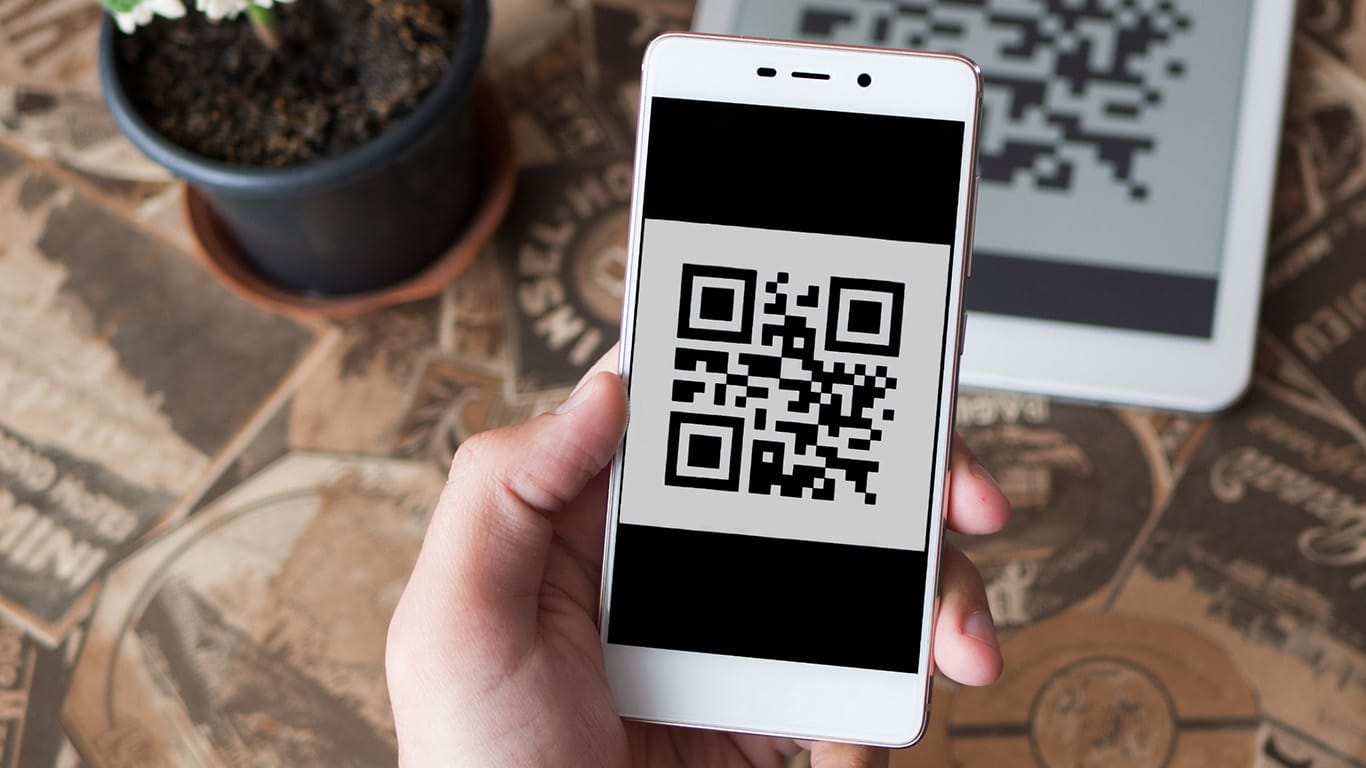
A QR Code turns a printed surface into a measurable one, because the scan passes through a server before reaching the destination and that server writes a row. You get a timestamp, a rough location and a device type, and none of those are modelled or estimated. Somebody was holding a phone at that moment and pointed it at your code.
The mechanism only works on dynamic codes, since a static code sends the reader straight to the destination with nothing in between to record. Mordor Intelligence attributes 64.92% of 2025 QR Code market revenue to dynamic codes, which is a reasonable proxy for how much of this market exists specifically to answer the attribution question.
The audience is not the obstacle here either, since EMARKETER’s February 2024 forecast put 38.0% of people in the US as scanning a QR Code at least once a year, which is more than 100 million people, so a code in a trade magazine is not asking readers to learn a new behaviour.
5 things a QR Code can see that monitoring cannot
Each blind spot below is paired with the tool that closes it most cheaply.
1. Whether the coverage produced any action at all, using The QR Code Generator (TQRCG)
This is the fundamental one, and it needs less tooling than people assume. A coverage report saying a piece reached 40,000 readers tells you nothing about whether 40,000 people, or four, did anything afterwards.
TQRCG’s two free trackable codes answer that question at no cost. The free plan gives you 2 free dynamic QR Codes that never expire, and each one records total scans, unique users, city, country and device across a 14-day window. Put one in a press pack and one in a printed feature, and the scan count becomes the first number in your coverage report that describes something a reader actually did rather than something a circulation figure estimated.
Unique users is the field that matters most for comms work, because it separates genuine reach from one enthusiastic person rescanning. A coverage figure cannot make that distinction at all, and here it arrives free.
The codes staying live through a downgrade or a cancellation matters for a reason specific to PR. Coverage has a long tail, and a feature published in March still gets read in September when somebody finds the magazine in a waiting room. A code that dies with a lapsed subscription stops measuring exactly the traffic that proves longevity.
Flex extends the scan window from 14 days to 60 and turns on CSV export, starting at $5 per month billed yearly for 5 dynamic QR Codes and reaching $10 per month billed yearly for 45. Sixty days covers a full coverage cycle including the tail, and the export matters because a comms report needs to sit alongside other data rather than inside a dashboard. Where TQRCG stops is integrations, which route through the Core Plan (powered by Uniqode) rather than either TQRCG tier, so scan data cannot be pushed into another system from Free or Flex.
2. Which specific placement worked, using Flowcode
Coverage reports aggregate by design, so a month of activity becomes one number, and the question of which outlet, which page or which event actually moved anybody stays unanswered.
The fix is a unique code per placement, and Flowcode adds a layer none of the others match, which is a hosted landing page behind each one. The free plan costs $0 a month and covers 2 dynamic codes, two mobile landing pages and analytics on your first 500 scans, with no advertising served.
That landing page changes what you are able to measure, because instead of knowing that 300 people scanned, you know that 300 scanned and 40 clicked through to the product page, which is a conversion rate for a printed magazine advert. Flowcode reports landing page click data alongside device, time and date, so the funnel from paper to action becomes visible in one place.
Pro Plus costs $25 per month billed annually for 50 codes and landing pages with analytics on 6,000 scans, which is enough for a code per outlet across a substantial campaign. The ceiling is the constraint, since 6,000 scans is roughly two months of a successful placement, and the codes keep resolving after the reporting stops.
3. What happened months later, using Bitly
Monitoring reports are built around a window, usually a month or a quarter, and coverage does not respect windows. A trade feature keeps producing scans long after the reporting period closed, and by then the report has been filed.
Bitly holds the longest retention ladder in this comparison, which is the specific thing that makes a year-on-year comparison possible. Data History runs 30 days on Core, 120 days on Growth, one year on Premium and two years on Enterprise, with nothing on the free plan. Full detail of every tier sits on the Bitly pricing page.
Two years of history lets you answer a question no monitoring tool can touch, which is whether this year’s campaign outperformed last year’s on actions rather than on mentions. That is the comparison a board asks for and the one most comms teams cannot produce.
The costs are worth stating plainly here. Core is $10 per month billed annually, an annual charge of $120, and carries 5 QR Codes and 5 redirects a month. Growth is $29 per month billed annually or $35 billed monthly, and it is the first tier with data export. City-level and device data both wait until Premium at $199 per month billed annually. Redirects are also unavailable on the free plan, so a free Bitly code cannot be repointed at all.
4. Offline response by publication, using QR Code Generator PRO
Print coverage is the hardest thing in a comms report to defend, because the link between a page and a visit is invisible. A code per publication makes it visible, and doing that at any scale means generating codes in batches rather than one at a time.
QR Code Generator PRO handles that end of the problem. Advanced costs $15.99 per month billed annually, an annual charge of $191.88, for 50 dynamic codes, unlimited scans and batch creation of 100 codes per upload. Professional costs $46.99 per month billed annually, $563.88 a year, for 250 codes, 500-code batches and five seats. Value added tax sits on top of all three figures.
The reporting format is the reason it appears here rather than elsewhere. Advanced and above export statistics as PDF as well as CSV, which means a coverage report can carry the scan data as a presentable document instead of a spreadsheet somebody has to reformat. For an agency reporting to a client monthly, that removes a recurring hour of work.
There is no free plan, only a 14-day trial, and their FAQ states that lapsed codes keep working for three further years, which suits print coverage with a long tail.
5. The long tail after the campaign budget ends, using QR Code Prime
Every campaign has an end date, and coverage does not. A feature keeps circulating, a printed insert stays in a waiting room, and a conference handout sits in somebody’s bag for months. Measuring that tail is awkward, because it happens after the reporting period, the budget and often the retainer have all closed.
QR Code Prime’s ten free dynamic codes suit that shape better than any paid tool, for the simple reason that there is no paid tier and therefore nothing to cancel. A free account carries 10 dynamic QR Codes with 500 tracked scans a month, reporting total scans, date, device and estimated location, and unlimited static codes sit alongside them.
Ten codes at no cost means you can leave a code running on every historic placement without ever having to justify a line item to anybody. When somebody asks in November whether the March feature is still producing anything, the answer exists, and it cost nothing to keep.
The 500-scan monthly ceiling is the limit and it fits this use case better than most, since a long tail is by definition low volume. There is no bulk creation, no export, and one independent developer maintains it with no published compliance certifications, so treat it as the tool for the quiet codes rather than the live campaign.
What each approach costs to run
| Blind spot | Tool | Free tier | What it adds | Entry paid price |
| Any action at all | TQRCG | 2 dynamic, 14-day history | Unique users, city, device, free | $5/month billed yearly |
| Which placement worked | Flowcode | 2 dynamic, 500 scans | Landing page click data | $25/month billed annually |
| Months later | Bitly | 2 codes, no history | Up to two years of retention | $10/month billed annually |
| Response by publication | QR Code Generator PRO | None, 14-day trial | Batch codes and PDF reports | $15.99/month billed annually |
| The long tail | QR Code Prime | 10 dynamic, 500 scans/month | Codes that never need renewing | No paid tier |
How do you set this up without a big budget?
Work through three steps, and the first one costs nothing at all.
Start with one code per outlet
Resist the urge to instrument everything at once, because one code per publication is enough to answer the only question that matters at the start, which is whether print coverage produces measurable action in your category at all.
Two free dynamic codes covers two outlets, which is a genuine pilot rather than a token one. If neither produces scans over a full coverage cycle, that is a finding worth having before anybody buys a plan.
Decide what counts as a result
A scan is not a result on its own, and treating it as one will eventually embarrass somebody. Decide in advance whether the result is a scan, a click through from a landing page, a form submission or a sale, and measure that consistently from the first placement.
This is where the landing page approach earns its cost. A scan count tells you attention was paid, whereas a click-through rate tells you something about intent, and the gap between those two numbers is usually the most interesting line in the report.
Keep the codes alive after the coverage stops
The tail is where QR Codes beat monitoring most clearly, and it is also the easiest thing to lose. A code switched off when a campaign closes stops measuring exactly the period that proves longevity.
Check the vendor’s terms on this point specifically. TQRCG states that its free dynamic codes stay live through a downgrade or cancellation, and QR Code Prime has no subscription to lapse at all. Bitly does not offer redirects on its free plan, so a free Bitly code cannot be repointed even while it is live.
Put a code in the next press pack
The cheapest useful experiment is one code, one outlet, one coverage cycle. Put a dynamic code in the next press pack pointing at a page you control, leave it for a month, and read the scan data alongside the coverage report.
You will learn two things almost immediately. Whether anybody scans at all in your sector, which varies enormously between consumer and industrial audiences, and whether the timing of the scans matches the publication date or trails it by weeks. Both answers change how you would build a larger programme, and neither costs anything to find out.
What comms teams ask about QR Code attribution
Can a QR Code replace media monitoring?
No, and it is worth being clear about that internally before anybody suggests it. Monitoring tells you where you appeared and roughly how many people could have seen it, which a QR Code cannot do. A code tells you what a smaller number of people actually did. The two measure different halves of the same campaign and neither substitutes for the other.
What percentage of readers will scan a code in a magazine?
Nobody in this comparison publishes a reliable figure, and any specific number you find elsewhere should be treated with suspicion unless it names a sample and a method. Scan rates vary by sector, placement, audience age and how clearly the code explains what it offers. Run your own pilot and use your own number, because that one will be right for your audience.
Do we need a different code for every publication?
Yes, if you want to know which one worked. A single code across five outlets produces one number and no attribution, whereas five codes produce five numbers and a ranking. That is the main reason batch creation matters once a programme grows past a handful of placements.
Can QR Code data go into our existing reporting?
That depends on the tier rather than the tool. CSV export arrives on TQRCG’s Flex plan, on Bitly’s Growth plan and on QR Code Generator PRO’s Advanced tier, whereas QR Code Prime does not offer export at all. If the data has to sit in a client report or a dashboard, check for export before choosing, since it is more often gated than people expect.
How long should we keep a coverage code running?
Longer than the campaign, because the tail is the part monitoring cannot see. A feature can produce scans six months after publication, and a code switched off at the end of the reporting period misses all of it. Free tiers that never expire are genuinely useful here, since keeping a historic code alive costs nothing and occasionally produces the most interesting slide in the annual review.