UA’s Eller Economic and Business Research Center reports Arizona lost 8,400 seasonally-adjusted jobs in June, following a revised decline of 3,300 in May. The preliminary May data showed a drop of 3,500. The state’s seasonally-adjusted unemployment rate was stable in June at 4.1%, equaling the national rate.
LEARN MORE: Rediscover Tempe with your best summer staycation yet
SUMMER FUN: 7 new and noteworthy Tempe restaurants to visit this summer
Arizona’s over the month job losses (seasonally adjusted) were concentrated in leisure and hospitality (down 3,800); professional and business services (down 3,600); financial activities (down 1,700); private education and health services (down 1,000); and information (down 600).
Offsetting the losses in June were gains in trade, transportation, and utilities (up 1,500); government (up 1,000); and construction (up 200).
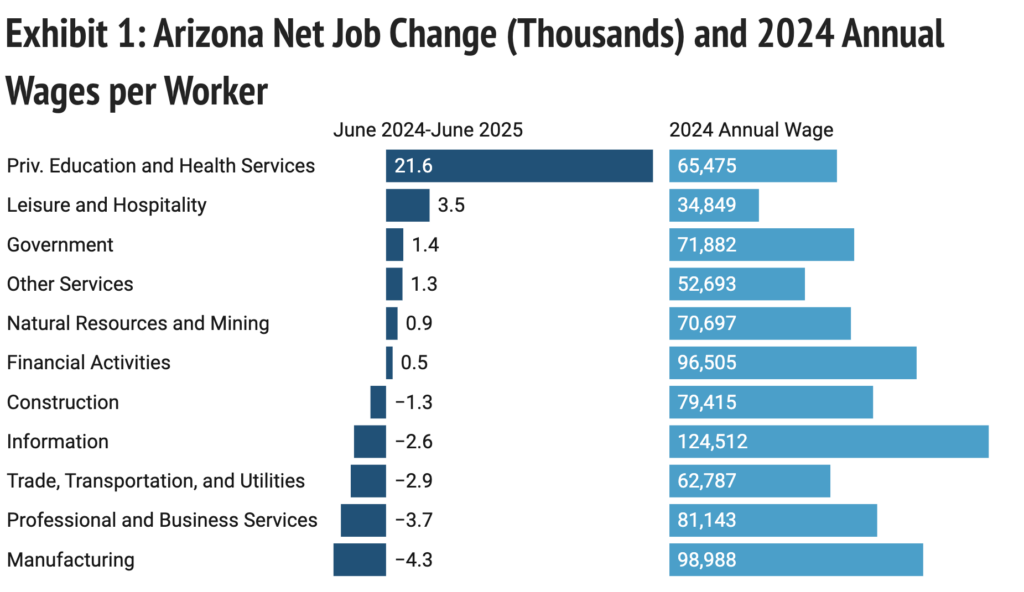
Over the year, Arizona added 14,400 jobs. That translated into 0.5% growth, which was below the national rate of 1.1%. As Exhibit 1 shows, private education and health services continued to drive gains in June, with much smaller increases in leisure and hospitality; government; other services; natural resources and mining; and financial activities.
Those gains were partially offset by losses in manufacturing; professional and business services; trade, transportation, and utilities; information; and construction.
Exhibit 1: Arizona Net Job Change (Thousands) and 2024 Annual Wages per Worker

Chart: Economic and Business Research Center, Eller College of Management, The University of ArizonaSource: U.S. BLSGet the dataCreated with Datawrapper
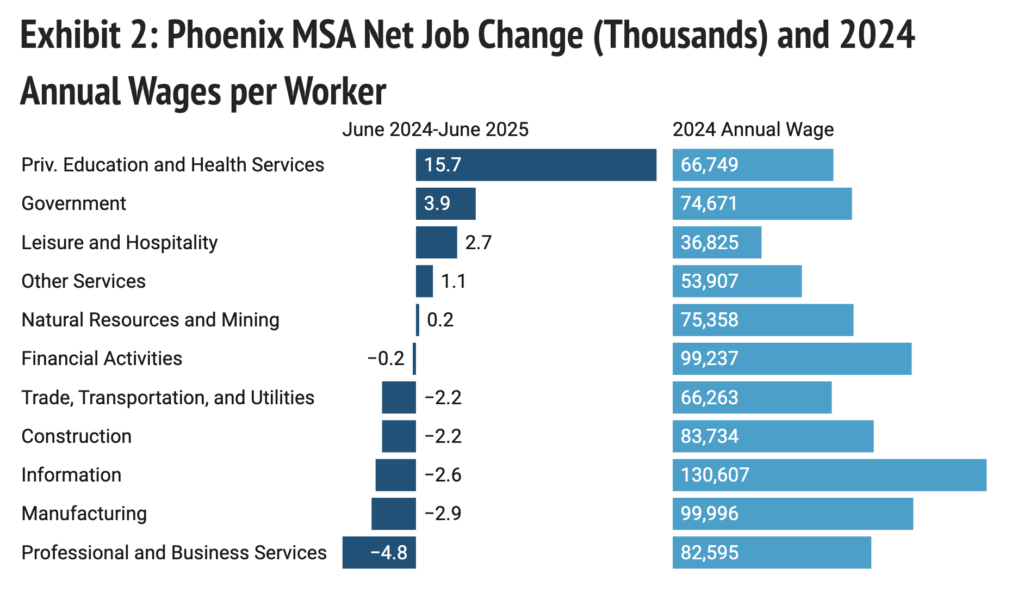
The Phoenix MSA added 8,700 jobs over the year in June, accounting for 60.4% of state gains. That translated into 0.4% growth. As Exhibit 2 shows, the pattern of gains/losses across industries was similar to the state.
Exhibit 2: Phoenix MSA Net Job Change (Thousands) and 2024 Annual Wages per Worker

Chart: Economic and Business Research Center, Eller College of Management, The University of ArizonaSource: U.S. BLSGet the dataCreated with Datawrapper
The Tucson MSA added 600 jobs over the year in June, for 0.2% growth. That accounted for 4.2% of state job gains.
Job gains were concentrated in private education and health services; leisure and hospitality; financial activities; and other services (Exhibit 3). Those gains were partly offset by losses in government; manufacturing; trade, transportation, and utilities; and construction.
Exhibit 3: Tucson MSA Net Job Change (Thous.) and 2024 Annual Wages per Worker

Chart: Economic and Business Research Center, Eller College of Management, The University of ArizonaSource: U.S. BLSGet the dataCreated with Datawrapper
The Prescott MSA lost 300 jobs over the year in June, for a decline of 0.4%. Leading the losses were trade, transportation, and utilities; manufacturing; leisure and hospitality; and professional and business services (Exhibit 4). Those losses were partly offset by gains in government; private education and health services; and other services.
Exhibit 4: Prescott MSA Net Job Change and 2024 Annual Wages per Worker

Chart: Economic and Business Research Center, Eller College of Management, The University of ArizonaSource: U.S. BLSGet the dataCreated with Datawrapper


