
As the economy continues to recover from the pandemic, labor costs will become an increasingly important issue, partly for their possible impact on inflation. The Employment Cost Index from the U.S. BLS will be a key indicator to track during the next year. The ECI measures the change in the cost of labor (including fringe benefits) adjusted for the influence of employment shifts across occupations and industries. Employment shifts across industries and occupations during the pandemic impacted growth in labor cost measures based on unadjusted averages (average hourly earnings, average wages per worker).
READ ALSO: Here are the 25 biggest employers in Arizona
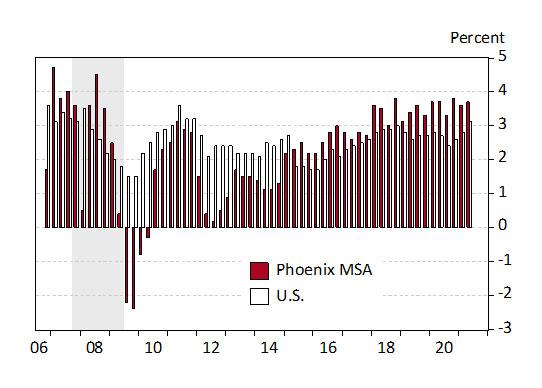
Exhibit 1 shows the ECI for the U.S. and the Phoenix MSA through the second quarter of 2021. Note that for the U.S. employment costs have accelerated recently, but are now rising at about the same rate as they were in 2010. Employment cost growth in the Phoenix MSA has been fairly stable at a rate above the U.S. average.
Exhibit 1: Growth in the Employment Cost Index, U.S. and Phoenix MSA, Percent
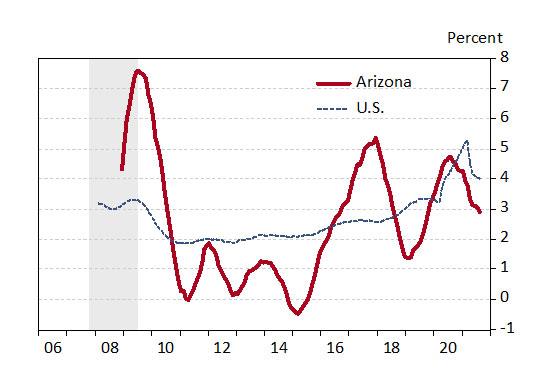
A different measure from the BLS is average hourly earnings for private-sector employees. This measure excludes fringe benefits and is not adjusted for employment shifts across industries or occupations. As of this writing, we have data through August 2021. This measure shows some impact from the pandemic, but the impact appears to be transitory (Exhibit 2). These data also tend to be volatile, so the exhibit displays smoothed data.
Exhibit 2: Growth in Average Hourly Earnings for the Private Sector for Arizona and the U.S., Seasonally Adjusted, Twelve-Month Moving Average
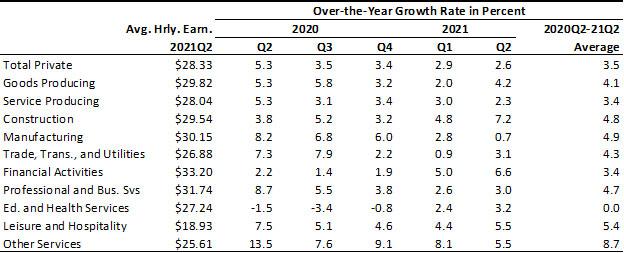
The BLS reports some industrial detail for average hourly earnings. These are shown in Exhibit 3 for Arizona. Monthly data is aggregated to quarterly, to smooth some of the volatility. For the five quarters ending with the second quarter of 2021, the fastest over-the-year average hourly was growth was posted by other services (8.7%), leisure and hospitality (5.4%), and manufacturing (4.8%). The slowest over-the-year wage growth was in educational and health services (0.0%), financial activities (3.4%), and trade, transportation, and utilities (4.3%).
Exhibit 3: Over-the-Year Growth in Arizona Average Hourly Earnings by Industry, in Percent
Compared to the Employment Cost Index and average hourly earnings, we get a much different picture using average wages per worker. These data are calculated by dividing total wages paid (excluding fringe benefits) by a measure of employment. Exhibit 4 shows two versions of this type of measure. One measure uses the total wage estimate from the U.S. Bureau of Economic Analysis divided by BLS total nonfarm payroll jobs (data through the second quarter of 2021). The other measure uses Quarterly Census of Employment and Wages (QCEW) data for total covered employment and wages (data through the first quarter of 2021).
Note the huge acceleration during the pandemic in both average measures. This reflects the fact that many of the jobs lost during the pandemic were in low-wage industries and occupations. This measure also abstracts from changes in the total wage bill driven by changes in hours worked.
Exhibit 4: Growth in Average Wages per Worker using BEA, and QCEW Data, Four-Quarter Moving Average
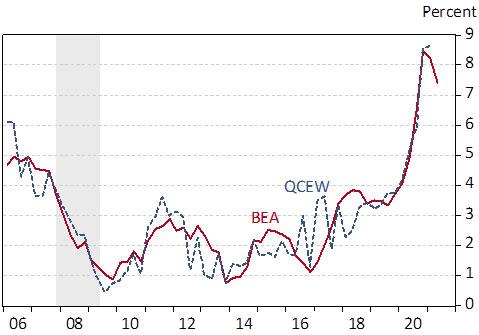
Exhibit 5 breaks Arizona over-the-year growth in private-sector average wages per worker (QCEW) down by two-digit NAICS. On average during the five quarters from the first quarter of 2020 to the same quarter of 2021, information generated the most rapid increase in wages (18.8%), followed by arts, entertainment, and recreation (12.9%), education services (12.3%), and retail trade (11.9%). Average wages per worker in transportation and warehousing fell by 3.1%, and increased slowly in accommodation and food services (2.7%), utilities (3.8%), and manufacturing (4.1%).
Exhibit 5: Arizona Average Wages per Worker by Two-Digit NAICS, Over-the-Year Growth Rates, in Percent
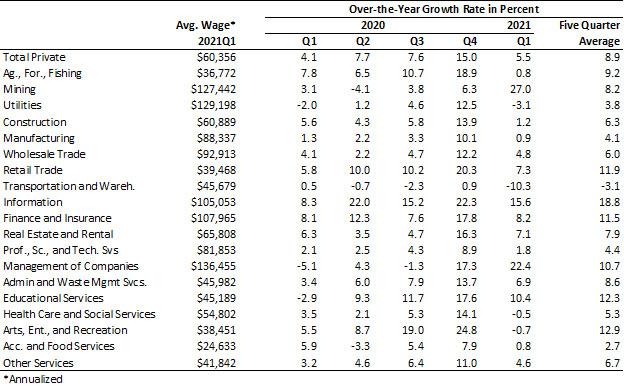
Note that wages calculated in this way can still be distorted by employment shifts across detailed sub-industries and occupations. For instance, information jobs were hit hard by the pandemic, but these losses were concentrated in lower-paid sectors (like motion picture and sound recording) whereas employment in higher-wage sectors (like data processing and hosting) likely held up better.
Overall, there has been some upward pressure on labor costs during the pandemic. The most reliable evidence of this comes from the ECI for the U.S. The ECI for the Phoenix MSA does not yet show much sign of upward pressure from the pandemic, although labor cost growth appears to be faster than nationally. There is some evidence of a temporary acceleration in Arizona in average hourly wages. While average wages per worker in Arizona surged upward during the past year, this was driven at least in part by pandemic-caused shifts in jobs across industries and occupations.
George W. Hammond, Ph.D., is the director and research professor at the Economic and Business Research Center (EBRC).