
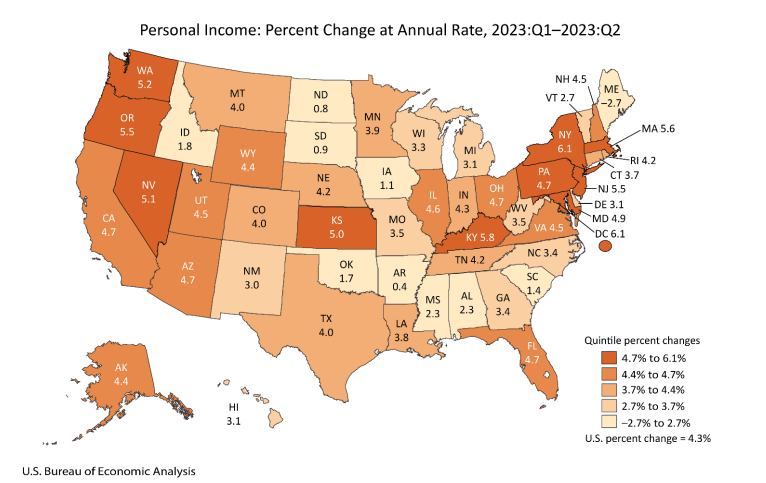
Arizona personal income increased at an annual rate of 4.7% in the second quarter, ranking at the top of the second quintile. Personal income increased in 49 states and the District of Columbia, with New York and the District of Columbia tied for the highest growth of 6.1%.
LEARN MORE: Money saving hacks: 18 readers share their best tips
Conversely, Maine was the only state with a decrease in personal income, with a 2.7% decrease. Nationally, personal income grew by $239.7 billion in the second quarter of 2023. Earnings, property income (dividends, interest, and rent), and transfer receipts all contributed to the increase. Net earnings growth was the highest contributor to personal income growth, rising 5.3% nationally. Property income for the nation increased at a 3.7% annual rate, and transfer receipts saw a moderate 1.7% increase.
The August 2023 release of the Job Openings and Labor Turnover (JOLTS) report stated that the number of job openings in the U.S. increased to 9.6 million, while the job openings rate increased to 5.8%. The industries that saw the largest increase in job openings were professional and business services, finance and insurance, and state and local government education. Nationally, the rate of hires changed little to 5.9 million, with a rate of 3.7%. Total separations in the nation were little changed at 5.7 million, with a separation rate of 3.6%. The number and quits changed little at 3.6 million and 2.3%, respectively. The number of layoffs and discharges changed little at 1.7 million and 1.1%. Other separations in the U.S. were reported at 357,000.
July home prices increased over the month for most of the metro areas tracked in the S&P CoreLogic Case-Shiller Index, including Phoenix. U.S. house prices gained 0.6% over the month and 1.0% over July of last year. On an annual basis, 12 of the 20 cities reported higher prices while eight had decreases. Phoenix house prices were among those that were lower, at -6.6%, as were most of the metro areas in the West. Las Vegas prices lowered the most at -7.2% followed by Phoenix and San Francisco at -6.2%. Chicago was again the metro area with the largest 12-month house price gains at 4.4% in July followed by Cleveland at 4.0% and New York at 3.8%.
The August goods and services trade deficit came in at $58.3 billion, down $6.4 billion from a revised $64.7 billion in July. August exports rose $4.1 billion from July to reach $256.0 billion. August imports saw a slight decline of $2.3 billion since July, reaching $314.3 billion. The decrease in the deficit reflects a decrease in the goods deficit of $5.5 billion to $84.5 billion and an increase in the services surplus of $1.0 billion to $26.2 billion. Over the year, the goods and services deficit decreased by $137.6 billion, or 20.7%. Exports increased $22.0 billion (1.1%), and imports decreased $115.6 billion (4.3%). South and Central America ($4.7), Netherlands ($3.0), and Hong Kong ($2.0) have the greatest surpluses, while China ($22.7), the European Union ($17.8) and Mexico ($12.8) have the greatest deficits (in billions).
Authors: Story by Delaney O’Kray-Murphy, EBRC research economist; Valorie Rice, senior business information specialist; and Alexandra Jaeger, EBRC web applications developer.