
Personal income increased in all Arizona counties between 2020 and 2021, according to the most recent U.S. Bureau of Economic Analysis annual income release on November 16. Most counties in the nation had increases in personal income for 2021, with the U.S. change at 7.5%, 7.4% in metropolitan counties, and 7.7% in nonmetropolitan counties. Per capita personal income (PCPI) was $64,143 in the U.S. for 2021, an increase of 7.3%. Maricopa had the largest PCPI in the state based on BEA calculations at $59,759, followed by Coconino at $56,914 and Pima at $52,942. The greatest increase in PCPI in 2021 was for Greenlee County, at 11.4% and $48,079. Per capita personal income for metropolitan areas in Arizona: $58,308 for Phoenix, $56,914 for Flagstaff, $52,942 for Tucson, $49,096 for Sierra Vista-Douglas, $49,060 for Prescott Valley-Prescott, $44,299 for Yuma, and $41,331 for Lake Havasu City-Kingman. Exhibit 1 shows county per capita personal income for 2021 in Arizona.
READ ALSO: Arizona property taxes will see No. 3 greatest 5-year increase
READ ALSO: Here’s the salary needed to buy a home in Phoenix
Exhibit 1: Per Capita Personal Income, Arizona Counties
Arizona’s unemployment rate ticked up to 3.9% in October from 3.7% in September. Total nonfarm employment increased 3.5% year over year in October, with education and health services garnering the most gains in employment over that period. Year over year job gains in Arizona metropolitan areas for October were 4.3% in Prescott, 4.0% in Phoenix, 4.0% in Flagstaff, 3.7% in Yuma, 2.6% in Lake Havasu City-Kingman, 2.4% in Tucson, and 1.8% in Sierra Vista-Douglas. To find more about how Arizona employment is faring, read Director George Hammond’s report, Arizona Job Growth Returns to Cruising Speed.
Phoenix reported an annual house price gain of 12.6% in September according to the S&P CoreLogic Case-Shiller November 29 release. The year-over-year price change for Phoenix has been steadily smaller since the early part of this year. Annual price gains nationally have moved lower for the last three months in a row, with the September gain at 10.6%. The 20-city composite had a 10.4% year-over-year gain in September compared to 13.1% in August and 16.0% in July. Miami had the largest 12-month house price gain at 24.6% while San Francisco posted the lowest twelve-month increase of 2.3%. Half of the 20 metropolitan areas represented in the index still had double-digit year over year price gains in September while all had monthly decreases in prices.
Arizona went from having the second largest annual house price appreciation in the first two quarters of the year down to 14 among all states for the third quarter with a 12-month increase of 14.4%. Florida, at 22.7%, remained the state with the largest one-year price increase for the third quarter in a row. The highest price increases for housing have shifted from the Mountain region to the South Atlantic over the last year based on the Federal Housing Finance Agency (FHFA) House Price Index report for the third quarter 2022 released November 29. Nationally, house prices increased 12.4% between the third quarter 2021 and the third quarter 2022 with prices in all 50 states and the District of Columbia increasing over the year. Metropolitan area data for all transactions (estimated using sales and appraisal data) indicate that Arizona metropolitan house price increases over the year have moderated, with third quarter figures at 22.2% in Phoenix, 20.6% in Tucson, 19.8% in Yuma, 19.3% in Lake Havasu City-Kingman, 19.0% in Prescott Valley-Prescott, 18.0% in Sierra Vista-Douglas, and 17.9% in Flagstaff. The all transactions increase for Arizona and the U.S. were 20.8% and 16.6%, respectively.
Arizona personal income increases
Average weekly wage increased 4.3% in the second quarter nationally. Maricopa County had a larger increase at 5.6% while Pima County was just below at 4.0%. Saratoga County, NY had the largest wage gain over the year for the second quarter at 16.3% according to the County Employment and Wages (QCEW) report released by the Bureau of Labor Statistics on November 22. Of the 355 largest counties in the country, 338 had employment increases between June 2021 and June 2022 including Maricopa and Pima, at 2.9% and 2.1% respectively compared to 4.0% nationally. Orange, FL had the largest increase in employment at 9.7% while Kanawha, WV declined 1.0%.
Arizona had a 0.8 percentage point increase in the hire rate for September to 4.6%, moving higher than the national rate of 4.0 (which was essentially unchanged from the previous month). The job openings rate for Arizona in September was 6.7%, up slightly from August (at 6.5%). Arizona quits rate was 3.6% compared to 2.7% for the U.S. based on the State Job Openings and Labor Turnover (JOLTS) release from the Bureau of Labor Statistics on November 17. The ratio of unemployed persons per job opening in Arizona was 0.6 in September, the same as the U.S.
The third quarter 2022 real gross domestic product (GDP) increased at an annual rate of 2.9%. This was a bit higher than the advance estimate of 2.6% issued a month ago. Upward revisions to consumer spending and nonresidential fixed investment tempered by a downward revision to private inventory investment were indicated for the higher second estimate released Nov 30 from the U.S. Bureau of Economic Analysis along with imports decreasing more than previously estimated. Real GDP decreased 0.6% nationally in the second quarter of 2022.
Most metropolitan areas in the nation posted lower unemployment rates in October than a year earlier (264 out of 389), but Arizona metro areas were among the exceptions as all experienced an increase. Yuma had the largest over-the-year rate increase at 5.2 percentage points, moving to 17.9% unemployment rate in October 2022, which was also the highest rate for the month among all metropolitan areas in the U.S. The lowest unemployment rate for the month was in Mankato-North Mankato, MN at 1.3% based on the December 1 Bureau of Labor Statistics release. Exhibit 2 includes the ability to compare any Arizona metropolitan area with the U.S. and Arizona by clicking on the metropolitan area name.
Exhibit 2: Arizona Metropolitan Area Unemployment Rates
Total nonfarm payroll employment in the U.S. rose 263,000 in November. Monthly job growth has averaged 392,000 so far this year compared with 562, 000 per month in 2021. November employment increases were most notable in leisure and hospitality, health care, and government. Average hourly earnings have increased 5.1% over the past 12 months according to the December 2 Bureau of Labor Statistics release. The unemployment rate was unchanged at 3.7% for November and has held close to steady since March, staying between 3.5% and 3.7% in that time. The labor force participation rate was 62.1% and the employment-population ratio was 59.9%, both of which have changed very little since early 2022.
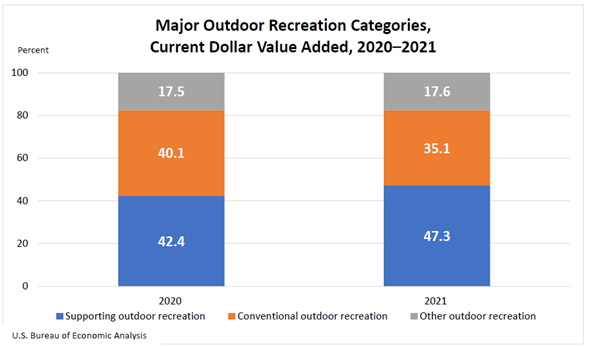
Outdoor recreation employment increased across all states in 2021 with Arizona outdoor recreation employment rising 17.8% compared to 13.1% nationally, based on a November 9 release from the Bureau of Economic Analysis. Arizona was towards the middle of all states with the value added for outdoor recreation as a share of state GDP which ranged between 4.8% in Hawaii to 1.3% in New York and Connecticut. It was 2.3% in Arizona. Nationally, the share was 1.9%. Supporting activities (such as construction, travel and tourism, local trips and government expenditures) accounted for a larger portion of outdoor recreational value added in 2021 than in 2020 (Exhibit 3), taking the place of conventional activities (such as bicycling, boating, hiking, and hunting). Value added for other activities (such as gardening and outdoor concerts) remained about the same between the two years.
Exhibit 3: Major Outdoor Recreational Categories, Current Dollar Value Added, 2020-2021
Author: Valorie H. Rice is the Senior Business Information Specialist at the Economic and Business Research Center (EBRC) in the University of Arizona’s Eller College of Management.