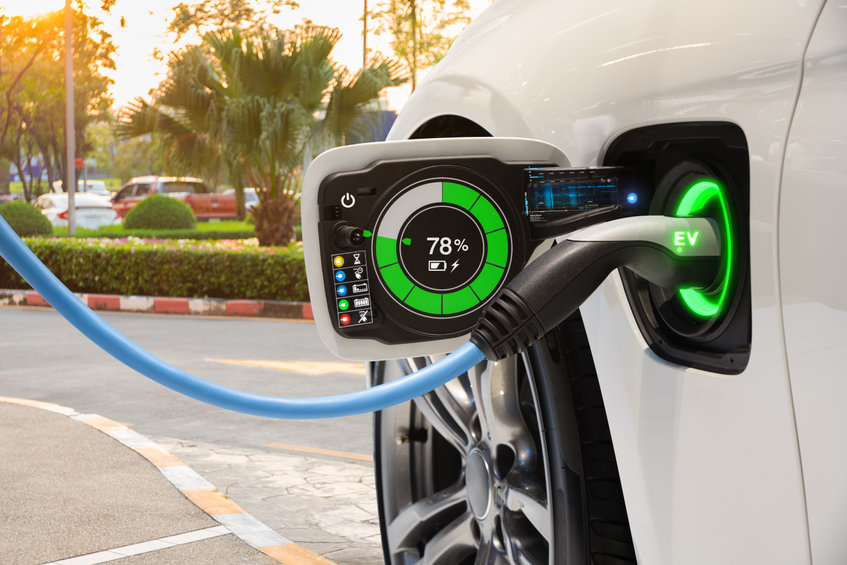
This is a watershed moment for electric vehicles.
U.S. President Joseph Biden called for half of all new vehicles to be electric or hybrid electric cars by 2030. A raft of major manufacturers—including Volkswagen, General Motors, Volvo and Audi—pledged to stop selling internal-combustion vehicles in the next 15 years.
READ ALSO: ElectraMeccanica picks Mesa as electric vehicles manufacturing site
Meanwhile, demand for electric cars is far outstripping supply. Industry leader Tesla broke $1 billion in quarterly income for the first time in July. Kelly Blue Book reports electric vehicle sales in the second quarter of this year were up 255% year-over-year.
Against this backdrop of burgeoning electric car interest, Bumper analyzed which states are best positioned for the growing demand for electric vehicles.
Our study ranks states looking at 10 metrics—five related to infrastructure, such as availability and growth of EV charging stations, and five related to financial considerations, including the cost to purchase and power EV cars and the average travel time to work.
Key takeaways
• Washington is the best state for owning an electric vehicle; Alaska, the worst. The top states include Washington, Utah, Colorado, Massachusetts and California. On the other end of the spectrum, Alaska, Alabama, South Carolina, Mississippi and South Dakota are the worst states.
• Washington and Illinois are the top states for financial incentives to own an EV. The top states across five broad categories charting financial incentives are Washington, Illinois, Utah, Colorado and Oregon. The worst states for financial incentives are Kansas, Alaska, South Carolina, South Dakota and Rhode Island.
• Vermont and California top the list for best electric vehicle infrastructure. States earning top scores for EV infrastructure are Vermont, California, Maryland, Massachusetts and Rhode Island. States at the bottom for infrastructure are Alaska, Kentucky, Louisiana, Wisconsin and Alabama.
• California and New York are leading the growth for the total number of new EV charge stations. From January 2017 through Aug. 5, 2021, the leader in new EV stations is by far California (11,833), followed by New York (2,273), Florida (1,901), Texas (1,771) and Massachusetts (1,662).
The states with the fewest EV stations opening since 2017 are South Dakota (30), Alaska (33), Wyoming (37), Montana (42) and North Dakota (49).
However, viewed by the number of charging stations per 100,000 residents, the rank changes to California (30.1), Vermont (30) Massachusetts (23.6), Utah (23.2) and Colorado (20.5). At the bottom of the list is Louisiana (1.9), followed by Mississippi (2.3), Kentucky (2.7), Alabama (2.9) and Indiana (3.1).
• California leads the way on registered EVs, but it’s far from supplanting gas-powered cars. California accounts for a whopping 41.7% of all registered electric vehicles nationwide as of Dec. 31, 2020, with 425,300, followed by Florida (58,160 EVs/5.7% of nationwide total), Texas (52,190/5.1%), Washington (50,520/5%) and New York (32,590/3.2%). States with the fewest EVs on the road were North Dakota (220/0.02%), Wyoming (330/0.03%), South Dakota (410/0.04%), West Virginia (600/0.06%) and Mississippi (780/0.08%).
Looking at EVs as a percentage of total vehicle registrations in each state, the leaders as of Dec. 31, 2020, were California (1.36%), Hawaii (0.84%), Washington (0.68%), Oregon (0.58%) and New Jersey (0.5%). At the bottom were North Dakota (0.02%), South Dakota (0.03%), West Virginia, Mississippi and Wyoming (0.04% each).
On average, only 0.24% of cars on the road in each state were electric vehicles in 2020.
Best states for electric cars
Overall scores were determined by average rank across 10 categories—the lower the score, the higher the average rank across categories. (See methodology for full details.)


Best and worst states by EV financial incentives


Best and worst states for EV registration nationwide

Methodology
Bumper ranked financial incentives by five metrics:
• Number of rebates and tax incentives found in each state
• Recharge cost
• Average price of gas
• Mean travel time to work
• State cost of an EV versus cost of a gas-powered vehicle
We ranked infrastructure scores by five metrics:
• Number of new charging stations since 2017
• Number of charging stations per 100,000 population
• Number of EVSE ports per 100 charging stations
• Number of EVSE ports per 100 EV vehicle registrations
• EV registrations as a percentage of all motor vehicles in the state
Sources: U.S. Department of Energy, Alternative Fuels Data Center; U.S. Energy Information Administration, State Electricity Profiles and Renewable & Alternative Fuels Vehicle Data; United States Census Bureau, American Community Survey; U.S. Department of Transportation, Federal Highway Administration – Policy and Governmental Affairs, Office of Highway Policy Information; U.S. Energy Information Administration, Independent Statistics & Analysis, State Profiles and Energy Estimates; Self Financial, Inc.; AAA; Federal Highway Administration; FuelEconomy.gov, National Renewable Energy Laboratory.
This story originally appeared on Bumper.


