Did Arizona fall into recession last year?
With the release of revised employment data for 2024, the picture of Arizona’s economy looks quite different. The revised (benchmarked) data show significantly slower job growth last year than did the preliminary data, with the estimate of state job growth falling from 2.1% over the year in the preliminary data falling to just 1.3% in the revised estimates. Job growth in the Phoenix MSA, the Tucson MSA, and national gains were also revised down (Exhibit 1). Did Arizona fall into recession last year?
Exhibit 1: Arizona Job Growth, 2023-2024, Before and After Revision, Percent
The size of the downward revision was surprising. Even more surprising was the monthly evolution of Arizona jobs last year. As Exhibit 2 shows, the revised data now include a huge drop in October 2023 and an extended period of job losses during the spring and summer months.
LOCAL NEWS: 100 best places to work and live in Arizona for 2025
INDUSTRY INSIGHTS: Want more news like this? Get our free newsletter here
Exhibit 2: Arizona Total Nonfarm Jobs, Preliminary and Revised, Seasonally Adjusted, Thousands
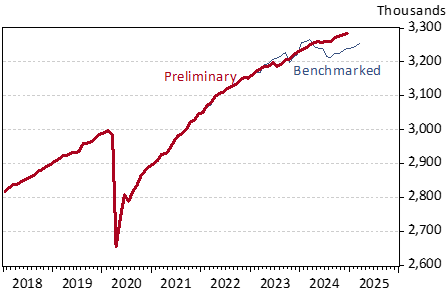
The job losses in October 2023 and during the March-August 2024 period were not small losses. Jobs declined by 31,100 in October 2023 and by 53,900 from March to August of last year. To put that into perspective, the state lost fewer jobs during the national downturns of the early 1990s and early 2000s, when state jobs dropped by 30,000 from March 2001 to December 2001 and 12,100 from January to July of 1991.
State job losses during 2023 and 2024 were widespread across sectors, not confined to just one or two. Exhibit 3 shows net job change in October 2023 by industry. While the largest declines were in private education and health services; construction; and trade, transportation, and utilities, all sectors posted losses for the month. It was a very strange month according to the data.
Exhibit 3: Arizona Net Job Change, October 2023, Over the Month, Seasonally Adjusted, Thousands
After that big decline, job growth resumes at a brisk pace, only to be interrupted by an extended period of losses beginning in March and ending in August of 2024. As Exhibit 4 shows, job losses were again widespread across sectors, with the largest losses in professional and business services. Jobs were up slightly in private education and health services and unchanged in natural resources and mining.
Exhibit 4: Arizona Net Job Change, March 2024 – August 2024, Seasonally Adjusted, Thousands
The data described above come from the Current Employment Statistics (CES) program. These data are based on a monthly survey of employers. Once each year in March, the CES data are revised or benchmarked. The main source of data used to benchmark the CES is the Quarterly Census of Employment and Wages (QCEW). QCEW data are based on employer tax payments for unemployment insurance.
Normally, the growth rate of the revised CES data is quite close to the QCEW growth rate (Exhibit 5). Note the unusual deviation during the July-December 2024 period. The next annual revision (to be released in March 2026) will incorporate the QCEW data from October 2024 through September 2025. That may help to close the gap.
Exhibit 5: Arizona Total Job Growth From the CES and QCEW Programs, Non-seasonally Adjusted, Over the Year, Percent

The question remains: what are we to make of Arizona’s economic performance during 2024 in light of the surprising CES job data? Was the state economy in recession, even briefly, last year? To shed light on that, we need to expand our focus to other measures of economic performance.
Exhibit 6 shows monthly data for the state of Arizona, covering nonfarm payroll jobs (CES), household employment from the household survey, real personal income less transfers, real taxable sales, and real GDP. Real personal income less transfers and real GDP are quarterly data, distributed to monthly. Nominal data for personal income less transfers and taxable sales were deflated using the Phoenix MSA all-items Consumer Price Index for Urban Consumers (CPIU). Taxable sales is a broad measure spanning a range of activities including amusements, hotels and motels, communications, mining, printing, publishing, restaurants and bars, rentals, contracting, utilities, retail plus remote, use, and utilities. These data are smoothed with trend/cycle.
Exhibit 6: Indicators of Arizona’s Economic Performance, January 2022=100
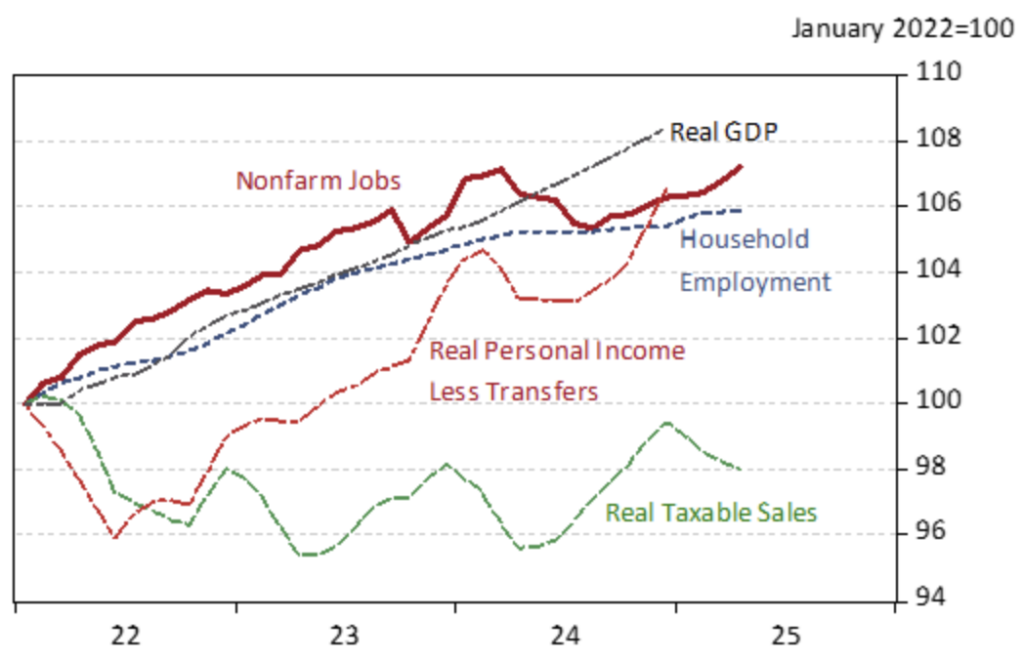
Most of the additional data suggest slowing state growth last year. Household employment comes from a survey of households and is different from (but not wholly independent of the nonfarm payroll job data from the CES). These data suggest slowing growth last year.
Real personal income less transfers, which includes wages and salaries, proprietor’s income, fringe benefits, as well as income from dividends, interest, and rent, also shows a significant decline last year. These data are influenced by wage and salary estimates from the QCEW.
Real taxable sales also suggest slowing last year, although that was not an unusual pattern for the series. The repeating pattern of declines through the early part of recent years suggests that the statistical filter used to smooth the data may not be completely eliminating normal seasonal variation.
The one series that suggests continued solid, or even accelerating growth, last year was real GDP.
It is safe to say that the evidence on Arizona’s growth last year is mixed and somewhat confusing. The overall theme is one of slowing growth, which is also reflected in the state’s unemployment rate (Exhibit 7). The unemployment rate has been trending up since March 2024, when it hit a low of 3.3%. Even so, the labor market remains tight, with the state rate well below its pre-pandemic level and well below the peaks during the national downturns of the early 1990s and early 2000s. Further, initial unemployment claims remain low.