
Despite a modest slowing at the end of 2022, the Arizona economy remains resilient. But what is the outlook for the Arizona economy in the coming months and years?
DEEPER DIVE: Karthik Kannan brings strong education lineage to Eller
According to preliminary data, the state continued adding jobs to close out the year, although the pace slowed. The unemployment rate ticked up modestly from historic lows reached last summer. The latest population data suggest rapid population growth through mid-2022, driven by accelerated net migration. In addition, Phoenix inflation has come off highs reached during the summer but remains very rapid. Single-family housing permits plummeted during the second half of 2022, as housing affordability rapidly deteriorated.
The baseline U.S. outlook calls for a mild recession during the first half of 2023. That translates into slowing growth in Arizona, Phoenix, and Tucson, but no outright recession. The Arizona economy remains well-positioned to outpace the nation. The pessimistic scenario calls for a more severe U.S. downturn, which generates job losses statewide this year. The optimistic alternative envisions a more robust national economy, which likewise generates faster gains in Arizona.
Arizona Recent Developments
On the inflation front, there is a bit of good news. Over-the-year inflation in Phoenix dropped from a peak of 13.0% in August 2022 to 8.5% in February. The national rate has also decelerated recently to 6.0% over the year in February. That was down from a peak of 9.1% in June.
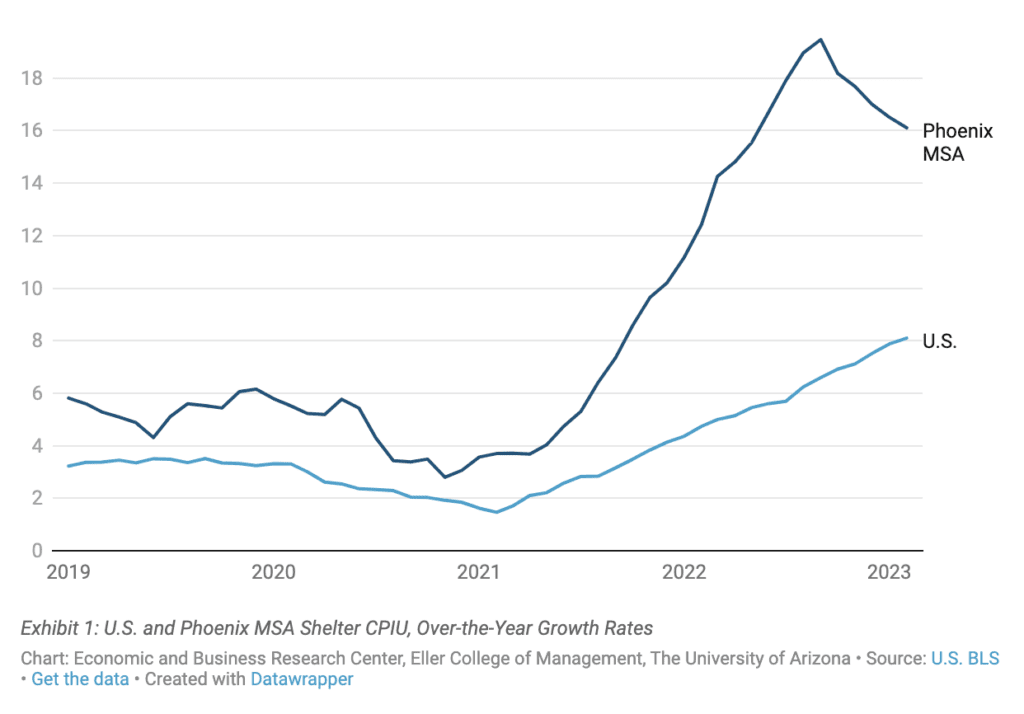
Both Phoenix and the nation have seen a significant deceleration in commodities inflation, with a much more modest slowdown in services inflation. One major factor driving this divergence is housing, which is included in the services index. Exhibit 1 shows shelter inflation (the largest component within the housing index) for Phoenix and the U.S. Shelter inflation is still very high in Phoenix, although on an over-the-year basis it cooled from 19.5% in September 2022 to 16.0% in February. Nationally, shelter inflation continued to gain speed in February at 8.1%.
Exhibit 1: Phoenix Inflation Shelter Cools a Little but Remains Elevated, Phoenix and U.S. Shelter CPIU, Over-the-Year Growth Rates
The huge increase in house prices since 2019, along with the recent increases in mortgage rates, have had a big negative impact on housing affordability nationally and in Arizona. Phoenix housing affordability (measured by the NAHB-Well Fargo Housing Opportunity Index) dropped from 64.9% in the fourth quarter of 2019 to 18.3% in the fourth quarter of 2022. That was a 46.6 percentage point drop in the share of homes sold that were affordable to a family making the median income. Tucson housing affordability dropped from 71.2% to 35.0% and in Prescott affordability declined from 55.9% to 18.6%. The nation experienced a decline from 63.2% to 38.1%.
Even so, housing remained more affordable in Arizona than in the major markets in California (a major source of migration to Arizona). In the fourth quarter of last year, only 2.2% of homes sold in Los Angeles were affordable to a family making the median income. Housing affordability was 7.3% in San Jose and 4.9% in San Francisco and San Diego.
As the Federal Reserve pushed up short-term interest rates last year, the 30-year conventional mortgage rate spiked from 3.1% in December 2021 to 6.4% in December 2022. That contributed to a significant drop in single-family permits issued in Arizona last year (preliminary Census data), which dropped from a revised total of 46,561 in 2021 to a preliminary count of 37,404 in 2022. That was a drop of 19.7% over the year. In contrast, multi-family permits increased significantly, rising by 24.2%. Overall, total permits were down 7.1% in 2022. Note that the Arizona forecast incorporates seasonally-adjusted quarterly data. Seasonal adjustment introduces small distortions to the annual data, so the Appendix Tables show slightly different results for 2022.
The statewide housing permit pattern was similar for the Phoenix MSA. Total permits dropped from a revised 50,581 in 2021 to a preliminary 46,939 last year. That 7.2% decline was driven by single-family permits, which declined by 21.9%, while multi-family permits increased by 23.9%. Tucson MSA total permits dropped from a revised 6,284 in 2021 to a preliminary 5,769 last year. Similar to the state and Phoenix, the drop was powered by single-family activity, down 25.9%, while multi-family permits rose 69.4%.
Arizona added 22,700 seasonally-adjusted jobs over the month in January 2023, up from a revised loss of 1,300 jobs in December. The preliminary estimates for December suggested that the state added 3,100 jobs in December.
Arizona’s seasonally-adjusted unemployment rate dropped to 3.8% in January, down from 4.0% in December. That was slightly above the national rate of 3.4% in January.
With the release of the preliminary January data, the Bureau of Labor Statistics (BLS) has released benchmarked (revised) estimates for prior years. The revisions primarily impact estimates for 2021 and 2022, although data for prior years may reflect revisions as well.
Also, with this release, the BLS has transitioned from 2017 North American Industrial Classification System (NAICS) codes to 2022 NAICS codes. The largest impacts of this change are in retail trade. Stay tuned for more on this in upcoming posts.
The benchmark revisions suggest stronger job growth in Arizona in 2021 and 2022. On an annual average basis, job growth for 2021 has been raised from 3.6% to 4.1%. For 2022, growth has been raised from 3.7% to 4.2%. In percentage terms, construction and professional and business services jobs were revised up significantly in both years.
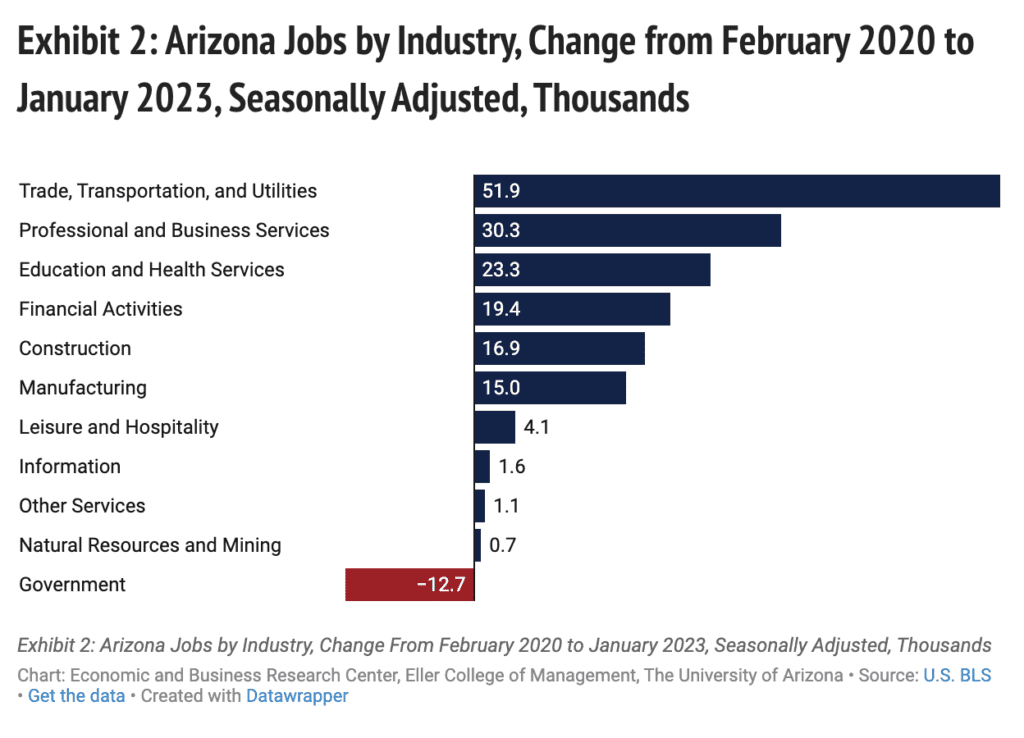
As Exhibit 2 shows, nearly all major industries in Arizona are now above their pre-pandemic employment level. The one sector that has yet to regain its pre-pandemic peak is government, particularly local government. Overall, total state jobs are estimated to be 151,600 above their pre-pandemic level.
Exhibit 2: Arizona Jobs by Industry, Change from February 2020 to January 2023, Seasonally Adjusted, Thousands
The Arizona Office of Economic Opportunity has released population estimates for Arizona and its counties and places. Their estimates suggest that Arizona’s population was 7.409 million as of July 1, 2022. That was up 123,800 from 2021, which translated into a growth rate of 1.7%. If correct, that was the fastest pace of population growth since 2007.
With natural decrease (more deaths than births) of 1,100 during the July 1, 2021 to June 30, 2022 period, implied net migration for Arizona was 124,900. That was up from net migration during the prior year of 113,900.
Phoenix MSA population rose by 1.9% (93,800). Natural increase of 8,100 generated implied net migration of 85,700, up from 76,700 in 2021. Tucson was estimated to have added 14,000 residents in 2022, which translated into a growth rate of 1.3%. Implied net migration was 16,400 in 2022, with natural decrease of 2,400.
Arizona Outlook
The outlook for Arizona, Phoenix, and Tucson depends in part on national and global economic events. The forecasts presented here are based on U.S. projections released by IHS Markit in January 2023. It was based on the following assumptions:
A transition from pandemic to endemic continues.
The forecast reflects legislation enacted before December 29 and current tax policy. It does not reflect the Consolidated Appropriations Act covering FY23. It does not include the cancellation of any student debt.
The Fed is assumed to raise its policy rate to a range of 4.75%-5.00% by March 2023, unchanged from the December forecast. It temporarily overshoots the terminal range of 2.5%-2.75%. The Fed’s balance sheet declines by about one-third through 2024.
Tariffs and trade agreements between the U.S. and China since 2017 are assumed to continue.
Real foreign GDP contracted by 4.7% in 2020. Growth rebounded to 5.6% in 2021. The forecast calls for it to slow to 3.3% in 2022 and again to 1.4% in 2023, which is close to the IHS Markit characterization of a global recession.
The price of Brent crude oil rose to $113 per barrel in the second quarter of 2022, up from $80 per barrel in the fourth quarter of 2021. The price is forecast to drop back to $86 per barrel by the first quarter of 2023 due to significantly slower global growth. After a modest rebound during the second half of 2023, prices settle around $87 per barrel in 2024.
The baseline forecast (summarized here) is assigned a 55% probability. The pessimistic scenario is assigned 25% and the optimistic scenario is assigned the remaining 20%.
The baseline forecast calls for real GDP to increase by 2.0% in 2022 (annual average basis) before slowing to 0.5% in 2023. Growth rebounds to 1.8% in 2024 and again to 2.0% in 2025.
On a quarterly basis, the forecast calls for U.S. real GDP to decline during the first and second quarters of 2023. The peak-to-trough decline is 0.6%, which would be similar to the (relatively mild) early 2000s recession.
If the U.S. economy slows significantly and falls into recession, it will take the wind out of Arizona’s sails.
Author: George W. Hammond, Ph.D., is the director and research professor at the Economic and Business Research Center (EBRC).