
After peaking at 13.0% over the year in August 2022, Phoenix MSA all-items consumer price inflation (as measured by the CPIU) cooled to 2.3% in August 2024 (Exhibit 1). At its peak, Phoenix inflation far exceeded the national average, which hit 9.1% in June 2022. Phoenix inflation has now been below 3.0% for 11 consecutive months and has been below the national average for 12 consecutive months. The U.S. all-items inflation rate was 2.5% over the year in August.
MORE NEWS: How numbers show Arizona economy is on a solid foundation
Exhibit 1: Phoenix MSA and U.S. Inflation Rates, CPIU All-Items, Over the Year, Percent
Core inflation, all items less food and energy, has also dropped significantly from its peak in the summer of 2022. For the Phoenix MSA, the core consumer price index rose 3.2% over the year in August, down from its peak of 12.3% in August 2022. Nationally, core inflation has decelerated from its peak in September 2022 (6.6%) to 3.2% in August 2024 (Exhibit 2).
Exhibit 2: Phoenix MSA and U.S. Inflation Rates, CPIU All Items Less Food and Energy, Over the Year, Percent
Huge declines in commodities inflation have contributed to decelerating price increases both nationally and in the Phoenix MSA (Exhibit 3). Commodities in the CPIU include tangible goods like new and used autos, furniture, apparel, food, gasoline, appliances, and others.
Phoenix commodities inflation has fallen from a peak of 14.7% over the year in June 2022 to an over-the-year decline of 2.5% in August 2024. Similarly, U.S. commodities inflation fell from 14.2% in March 2022 to a decline of 1.2% in August. Major supply chain disruptions during the pandemic contributed meaningfully to commodities inflation as the economy roared back to life. As those disruptions have been eliminated, a major commodities inflation has become a modest deflation.
Exhibit 3: Phoenix MSA and U.S. Inflation Rates, CPIU Commodities, Over the Year, Percent
While consumer commodities prices contributed to the recent inflation cycle, they were not the main driver. That is because the all-items consumer price index is a weighted average of price changes for the goods and services that U.S. consumers purchase. The size of the weight for a given good or service depends on its size in an average consumers budget. As it turns out, commodities do not account for the largest share of consumer spending. That falls to services, which are intangible goods like health care, education, recreation, housing, and others.
As Exhibit 4 shows, services inflation in the Phoenix MSA and nationally has also decelerated significantly from peaks during the summer of 2022. In Phoenix, services inflation peaked at 13.3% over the year in August 2022. By August 2024, that was down to 5.0%. The pattern was similar nationally, with services inflation peaking at 7.6% in January/February 2023 and falling to 4.8% in August 2024.
Exhibit 4: Phoenix MSA and U.S. Inflation Rates, CPIU Services, Over the Year, Percent
Within services, housing is by far the largest component. Within housing, shelter is the most important component. Shelter includes rent, imputed owner-occupied rent, and short-term rentals. As Exhibit 5 shows, shelter inflation in the Phoenix MSA peaked at a level more than double the nation. In Phoenix, shelter inflation hit a high of 19.5% in September 2022 compared to a nationwide high of 8.2% in March 2023. Since then shelter inflation has come down significantly, falling to 3.8% in Phoenix and 5.2% nationally.
Exhibit 5: Phoenix MSA and U.S. Inflation Rates, CPIU Shelter, Over the Year, Percent
The graphs above allow us to address a couple of key questions. First, why did inflation in the Phoenix MSA surge so much higher in the summer of 2022 than it did nationally? The answer is housing. House prices and rents (as reflected the shelter CPIU) rose much faster in the Phoenix MSA than they did nationally. That drove services inflation in Phoenix far above the U.S. Commodities inflation, in contrast, was very similar in Phoenix and nationally.
Second, why has Phoenix MSA inflation decelerated since the summer of 2022. Here the answer is both a deceleration (and modest deflation) in commodities inflation and a big deceleration in services inflation, driven by shelter.
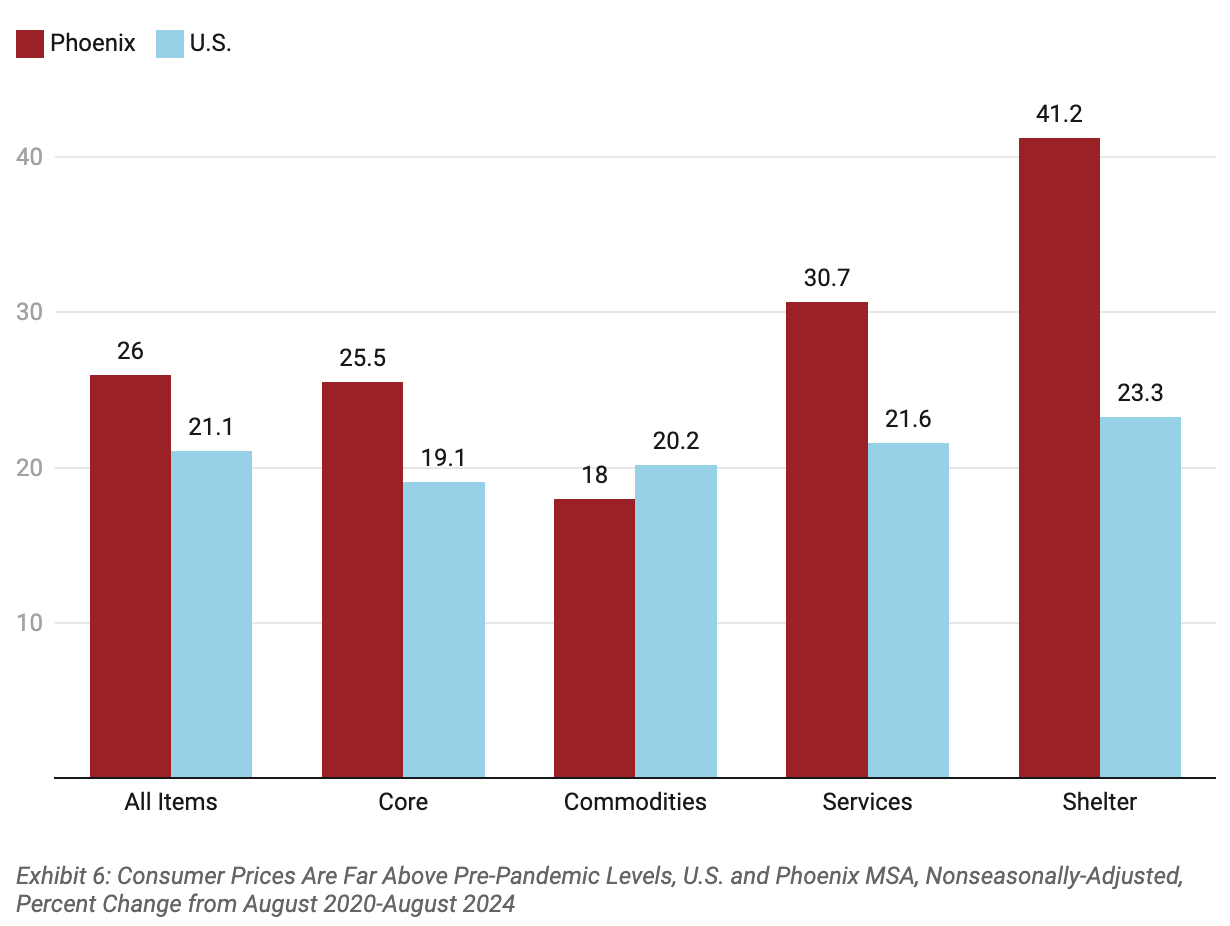
Even though inflation in the Phoenix MSA and nationally has moderated significantly, that does not mean that prices have returned to pre-pandemic levels. Exhibit 6 shows the percent change of consumer prices from August 2020 to August 2024 for the Phoenix MSA and the U.S.
Note that the all-items CPIU for Phoenix was up 26.0% during the four year period, compared to 21.1% nationally. That was driven by the services CPIU, which in turn reflected the 41.2% increase in shelter prices in Phoenix. Shelter prices nationally were up just 23.3%. Commodities prices were actually up less in Phoenix than nationally during the period (18.0% in Phoenix versus 20.2% nationally).
Exhibit 6: Consumer Prices Are Far Above Pre-Pandemic Levels, U.S. and Phoenix MSA, Nonseasonally-Adjusted, Percent Change from August 2020-August 2024
Author: George W. Hammond, Ph.D., is the director and research professor at the Economic and Business Research Center (EBRC).