A new study reveals which states and metro areas have the most and least disposable income, including the Arizona cities where people have the most disposable income.
Researchers at CashNetUSA analyzed cost-of-living data from MIT and average wage data from the Bureau of Labor Statistics, and calculated how much money the average person has left after covering essential expenses in each state and major metro area.
They found that the average Arizona resident has around $12,237 of disposable income each year (approximately $1,020 per month). However, wages and cost of living vary greatly across the state, and people in some cities have far more disposable income than others.
Arizona disposable income
Here are the metro areas around Arizona where residents have the most and least disposable income. Tucson residents have the most disposable income ($16,115). Meanwhile, the average cost of living outweighs the average salary in Flagstaff, leaving the average person -$717 at the end of the year:
| Metro Area | Leftover Disposable Income (Annual) |
| Tucson, AZ | $16,115 |
| Sierra Vista-Douglas, AZ | $15,843 |
| Phoenix-Mesa-Chandler, AZ | $11,456 |
| Prescott Valley-Prescott, AZ | $7,427 |
| Yuma, AZ | $7,080 |
| Lake Havasu City-Kingman, AZ | $6,258 |
| Flagstaff, AZ | -$717 |
Experts suggest putting aside around 20% of your monthly income and maintaining emergency savings to cover three to six months of expenses. But nearly one in five (18.7%) American households spend their full income as regularly as they earn it, according to the Federal Reserve Bank of St. Louis — so-called hand-to-mouth living. Many are high-earning, high-consumption households, but around one-third may be spending their full income on necessities.
In fact, the Federal Reserve Board found that just 54% of U.S. adults have enough savings to get by if they lose their main source of income. And those with the lowest income and the smallest savings are most vulnerable to changes in their personal circumstances or fluctuations in the economy. For example, while the tariff raises of April ’25 are designed to boost wages and create more American jobs, Yale’s Budget Lab notes that, in general, “tariffs burden households at the bottom of the income ladder more than those at the top as a share of income.”
CashNetUSA is here to help you get your finances on track. That is why we have built a free Monthly Budget Calculator you can use to plan your household spending month on month. Just enter your income and outgoings to see how your lifestyle adds up — and where you might be able to cut back if necessary.
Key Findings
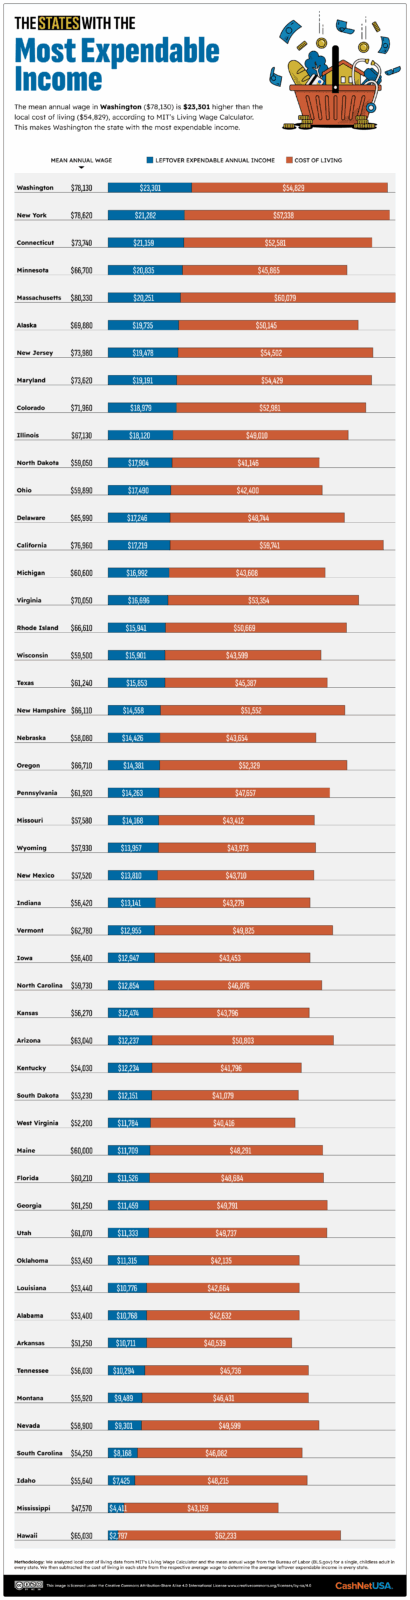
● Single people in Washington have an average of $23,301 in expendable income annually — more than in any other state.
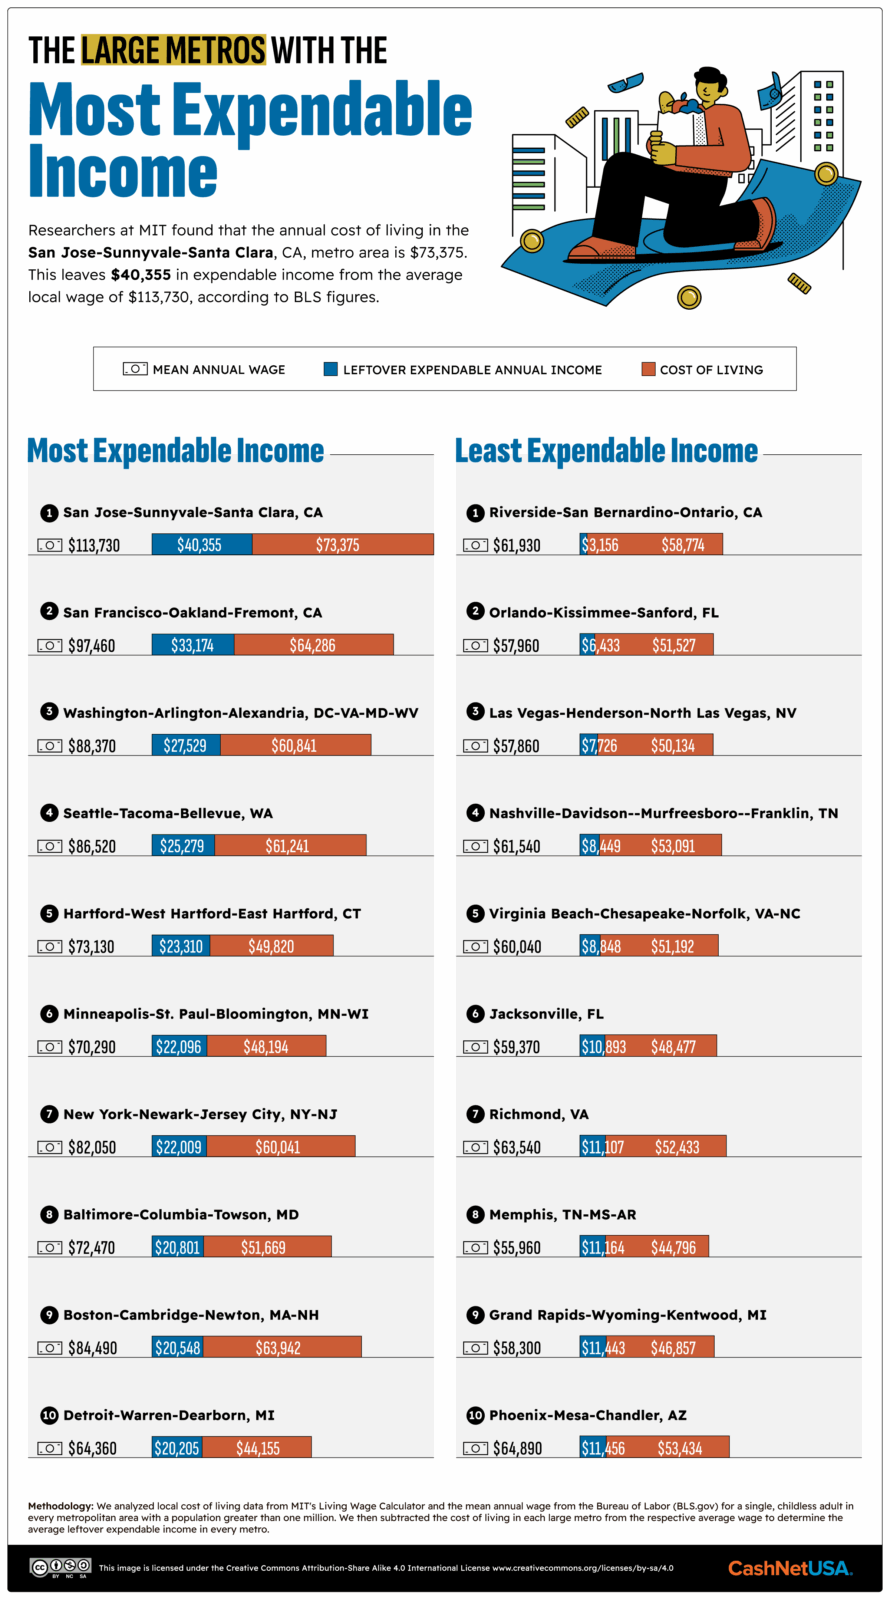
● The metropolitan area where people have the most annual expendable income on average is San Jose-Sunnyvale-Santa Clara, CA ($40,355).
● The metro with the least expendable income is Santa Cruz-Watsonville, CA, where the average annual cost of living is $13,351 more than the average local income.