With the year-over-year inflation rate at 3% in January, the personal-finance website WalletHub today released its updated report on the Changes in Inflation by City and found that Phoenix is the city with the second-lowest inflation problem in the U.S.
MORE NEWS: Phoenix bucket list: 25 things you must do
INDUSTRY INSIGHTS: Want more news like this? Get our free newsletter here
The U.S. inflation rate hit a 40-year high after the pandemic but has since cooled significantly due to factors like the Federal Reserve rate hikes. The year-over-year inflation rate sits at 3% as of January 2025, which is still above the target rate of 2%. Various factors, such as the war in Ukraine and labor shortages, drive this higher than average inflation. Despite the country not meeting its target yet, the Federal Reserve will keep interest rates at the level set in December 2024.
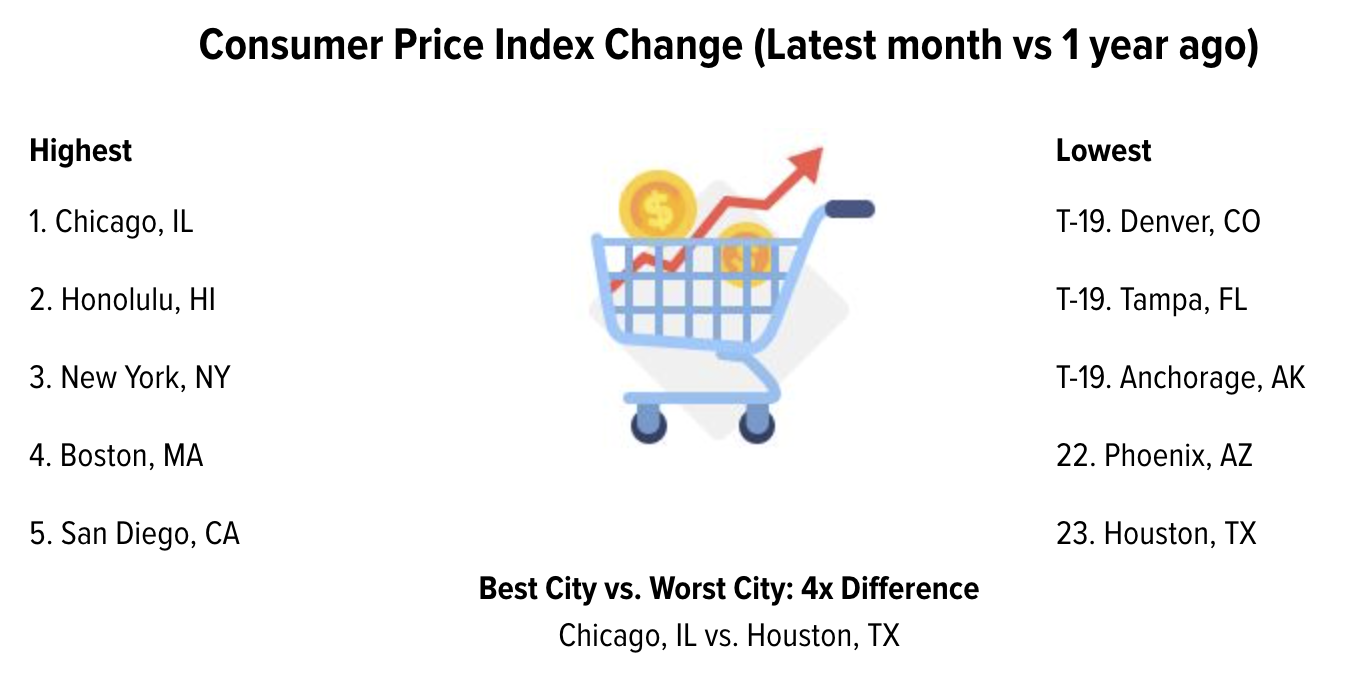
Inflation rates differ across the U.S., though. To determine how inflation is impacting people in different parts of the country, WalletHub compared 23 major MSAs (Metropolitan Statistical Areas) across two key metrics related to the Consumer Price Index, which measures inflation. We compared the Consumer Price Index for the latest month for which BLS data is available to two months prior and one year prior to get a snapshot of how inflation has changed in the short and long term.
Main Findings
Cities With the Biggest Inflation Problems
| Overall Rank | MSA | Total Score | Consumer Price Index Change (Latest month vs 2 months before) | Consumer Price Index Change (Latest month vs 1 year ago) |
|---|---|---|---|---|
| 1 | Chicago-Naperville-Elgin, IL-IN-WI | 89.66 | 1.20% | 4.30% |
| 2 | San Diego-Carlsbad, CA | 88.98 | 1.60% | 3.80% |
| 3 | Boston-Cambridge-Newton, MA-NH | 88.77 | 1.50% | 3.90% |
| 4 | Urban Honolulu, HI | 83.18 | 1.00% | 4.10% |
| 5 | Riverside-San Bernardino-Ontario, CA | 78.79 | 1.80% | 2.90% |
| 6 | New York-Newark-Jersey City, NY-NJ-PA | 78.21 | 0.80% | 4.00% |
| 7 | Dallas-Fort Worth-Arlington, TX | 75.55 | 1.70% | 2.80% |
| 8 | Minneapolis-St.Paul-Bloomington, MN-WI | 75.13 | 1.50% | 3.00% |
| 9 | Los Angeles-Long Beach-Anaheim, CA | 72.78 | 1.10% | 3.30% |
| 10 | Tampa-St. Petersburg-Clearwater, FL | 59.35 | 1.20% | 2.30% |
| 11 | St. Louis, MO-IL | 55.96 | 0.30% | 3.10% |
| 12 | Philadelphia-Camden-Wilmington, PA-NJ-DE-MD | 53.81 | 0.00% | 3.30% |
| 13 | Atlanta-Sandy Springs-Roswell, GA | 53.55 | 0.60% | 2.60% |
| 14 | Washington-Arlington-Alexandria, DC-VA-MD-WV | 53.34 | 0.50% | 2.70% |
| 15 | Baltimore-Columbia-Towson, MD | 48.43 | -0.40% | 3.40% |
| 16 | Miami-Fort Lauderdale-West Palm Beach, FL | 44.51 | -0.10% | 2.80% |
| 17 | Denver-Aurora-Lakewood, CO | 42.11 | 0.20% | 2.30% |
| 18 | Detroit-Warren-Dearborn, MI | 37.62 | -0.50% | 2.80% |
| 19 | Seattle-Tacoma-Bellevue, WA | 36.10 | -0.50% | 2.70% |
| 20 | San Francisco-Oakland-Hayward, CA | 33.28 | -0.40% | 2.40% |
| 21 | Anchorage, AK | 24.87 | -0.80% | 2.30% |
| 22 | Phoenix-Mesa-Scottsdale, AZ | 14.26 | -0.80% | 1.60% |
| 23 | Houston-The Woodlands-Sugar Land, TX | 0.00 | -1.10% | 1.00% |
How Phoenix inflation rates