Maricopa County led the nation in population growth between July 1, 2021, and July 1, 2022, based on the most recent county-level population estimates released from the U.S. Census Bureau. According to the data, domestic migration comprised the most substantial portion of Maricopa County’s population gain over the year. While Maricopa County population growth showed the most significant nominal increase, Texas held six out of the top 10 counties for numeric growth, and Florida retained three for the year. The two most populous counties in the nation: Los Angeles County, California and Cook County, Illinois, realized the worst declines in population over the year. Most Arizona counties experienced a boost in population between 2021 and 2022, though three counties lost population: Cochise, Graham, and Greenlee. Pinal County held the top position for percent change in population for Arizona with a 3.6% gain, followed by Mohave at 1.8%. Maricopa County, with the leading increase in people for the state and the nation, grew 1.3%.
DEEPER DIVE: Arizona personal income growth ends 2022 on a high note
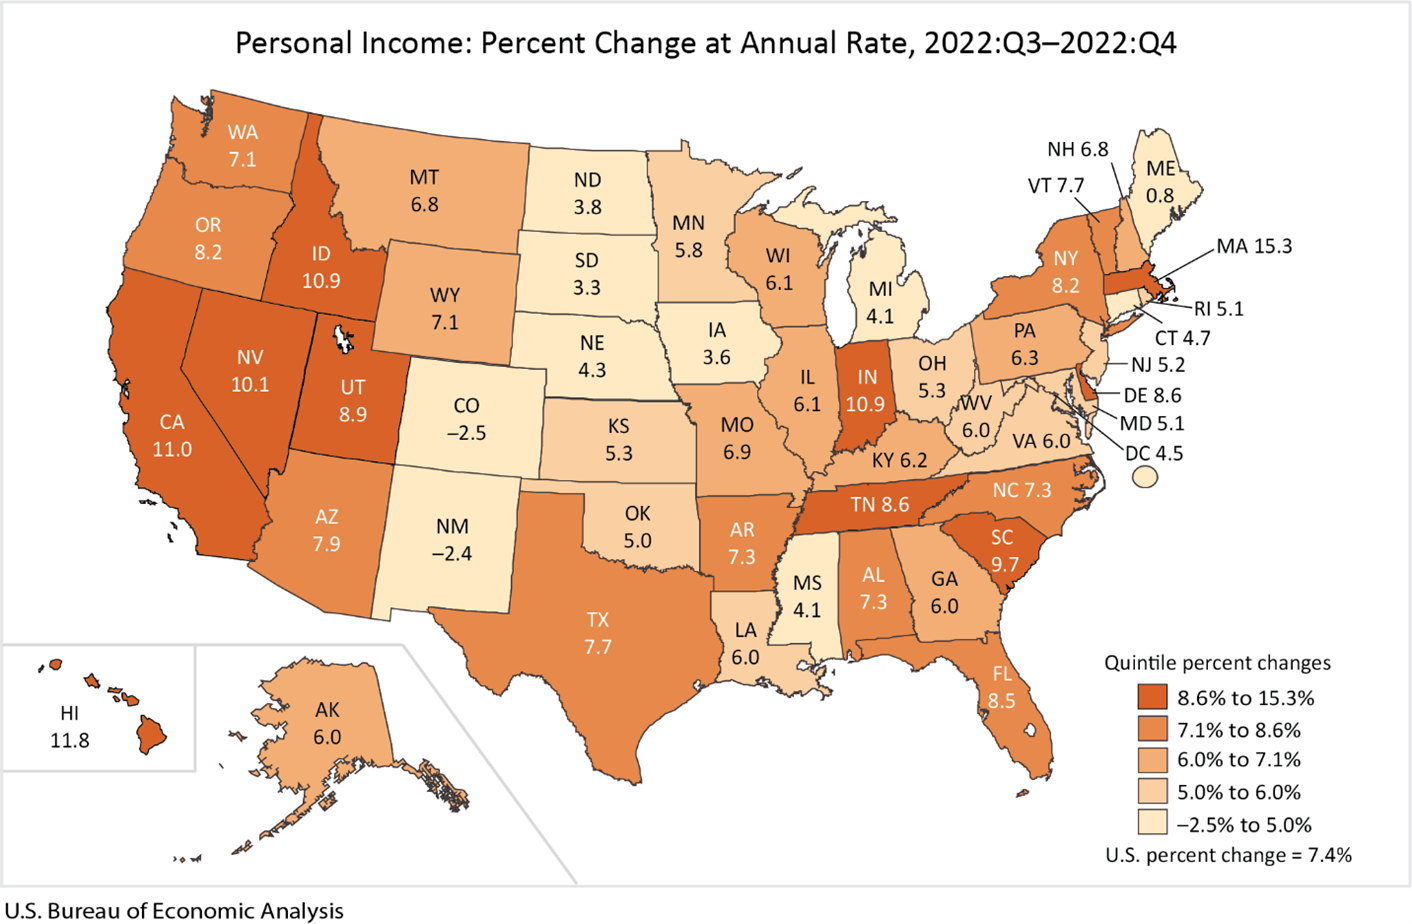
Beyond Maricopa County population growth, Arizona personal income for the fourth quarter of 2022 increased 7.9% on a seasonally adjusted annual basis, ranking it in the second highest quintile among states according to the March 31st U.S. Bureau of Economic Analysis release. Arizona ranked 14th for personal income growth in the fourth quarter, with Massachusetts ranked first at a 15.3% increase and Colorado last with a -2.5% change. Arizona personal income experienced four solid quarters throughout 2022, with Q1-Q4 as follows: 1.5%, 8.2%, 6.7%, and 7.9% (seasonally adjusted at annual rates). The most significant movement within personal income occurred in the dividends, interest, and rent category at a 9.8% increase, followed by transfer receipts at 8.9% and personal income at 7.9%. Net earnings increased by 6.9% for the state.
Job Openings and Labor Turnover Survey state-level data released on March 21st indicate Arizona observed 225,000 job openings in January, 4.7% lower than last January. Despite this decrease, the number of hires in Arizona came in at 159,000, up 1.9% over the year. Arizona’s job separations hit 125,000, down 19.4% from January 2022. Based on the preliminary data, the primary driver of this trend was the total quits which amounted to 87,000, accounting for around 80% of the decrease in total separations. Layoffs and discharges in the state remained relatively stable, coming in at 30,000, representing a 9.1% decline year-over-year.
Producer prices continued to decline in February. The total final demand dropped 0.1% over the month on a seasonally adjusted basis. Final demand goods fell by 0.2% in February after increasing by 1.2% in January. The 2.2% decline in food majorly affected the shift, with eggs declining 36.1% in price. Final demand services decreased by 0.1%, the same as the month prior, according to the March 15th U.S. Bureau of Labor Statistics release. The 12-month change in total final demand producer prices for February sat at 4.6% before seasonal adjustment, down from its high of 11.7% in March 2022.
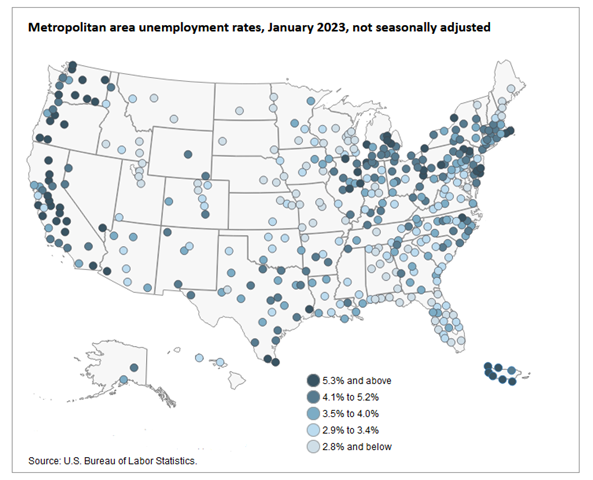
On March 17th, the U.S. Bureau of Labor Statistics released its Metropolitan Area Employment and Unemployment Summary, reporting the January 2023 statistics and making annual revisions to information from the prior year (2022). The national unemployment rate decreased in the year since January 2022, sliding from 4.4% to 3.9% this January. The lowest unemployment rates for January 2023 occurred in Rapid City, SD, and Sioux Falls, SD, at 1.9% each, while the highest unemployment rate occurred in El Centro, CA, at 16.2%. Unemployment in Arizona metropolitan areas remained primarily unchanged between December 2022 and January 2023, with Yuma being the only area to see significant change – moving from an unemployment rate of 10.8% in December to a 9.8% rate in January. However, part of this change may originate from movement within the labor market, as the number of unemployed and the size of the civilian labor force decreased by around the same number over this period. Tucson and Lake Havasu City-Kingman decreased their unemployment from December by 0.1 percentage point, landing at 3.2% and 4.0%, respectively. Arizona’s labor market remains strong, with low unemployment throughout most of the state and an increasing civilian labor force.
The January data release for Phoenix home prices suggests a continuation of their descent toward previous levels. The 12-month change in prices came in ever so slightly positive at 0.01% above January 2022 levels. Nationally, the 12-month change in prices sits at 3.8% year-over-year. January marks the seventh consecutive month with declining house prices nationally and in Phoenix. Despite this, the annual gain for the 20-city composite remained positive at 2.5%. Florida cities of Miami and Tampa posted the only double-digit annual increases at 13.8% and 10.5%, respectively, topping the index for price changes. Four cities had negative annual changes: San Francisco, Seattle, San Diego, and Portland.
The U.S. Consumer Price Index increased by 0.4% in February 2023 after an increase of 0.5% in January and a 0.1% increase in December (seasonally adjusted). The Fed anticipated this increase in CPI, contributing to their interest rate hike earlier this month. The annual inflation rate reached 6% in February, the lowest since September 2021, making this the eighth consecutive month that the annual rate declined. Increases in shelter costs contributed the most towards the monthly increment, composing roughly 70% of the overall change. Energy prices fell 0.6% for the month, bringing the year-over-year increase to 5.2%, while shelter increased 0.8%, leading to an annual gain of 8.1%. On a year-over-year basis, prices for food at home rose 10.2%, surpassing all other categories’ changes.
CPI-U in Phoenix increased by 1.2% in the past two months ending February 2023. higher food and shelter prices primarily influenced this increase. Compared to the past 12 months, the CPI-U for Phoenix increased by 8.5%. This figure shows a deceleration in the inflation rate for Phoenix compared to the previous months, but it still ranks among the nation’s highest. Phoenix holds the nation’s second-highest CPI after Miami at 9.9%. Food prices saw some of the most significant changes at 2.7% for the two months. Year-over-year, food prices have increased by 10.1% while shelter increased by 16.1%.
Authors: Contributing to this article were EBRC staff members Delaney O’Kray-Murphy, Valorie Rice, and Shaw Zeider along with EBRC student researchers Prarthana Magon and Utsav Kataria.