
Phoenix inflation, once the highest in the nation, is now lower than the national average, according to current data releases as of May 24, 2024.
MORE NEWS: These 7 Metro Phoenix cities see home prices double fastest
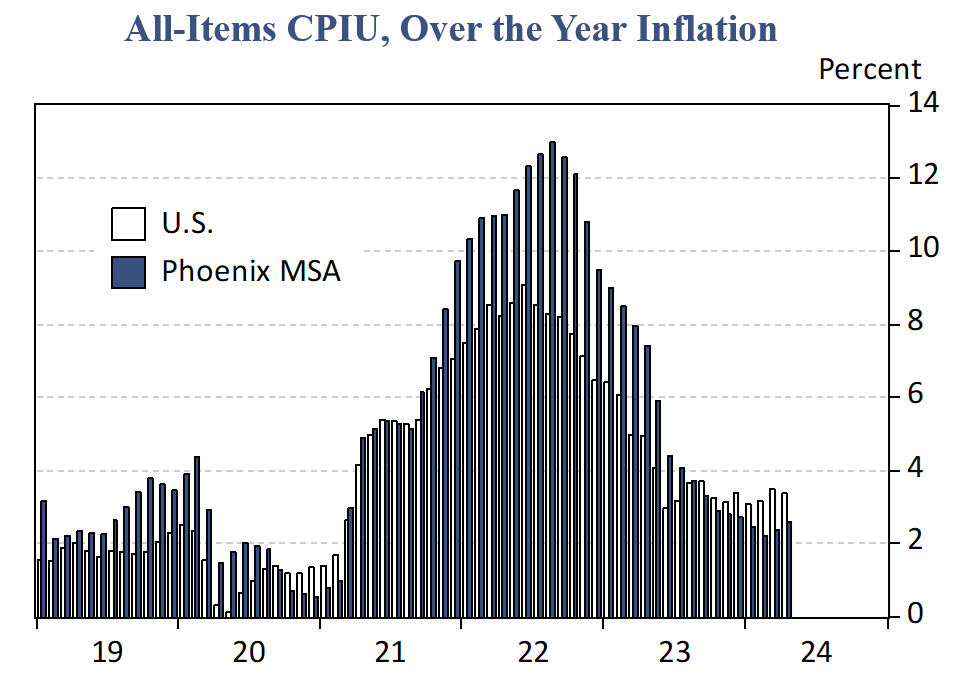
Consumer prices increased 0.3% in April on a seasonally adjusted basis. Shelter and gasoline combined contributed most of the monthly change in the Consumer Price Index for All Urban Consumers (CPI-U) based on the U.S. Bureau of Labor Statistics May 15 release. The energy index increased 1.1% over the month while the food index was unchanged. The index for all items less food and energy ticked down to 0.3% in April after posting a 0.4% increase in the previous three months. The annual inflation rate for April was 3.4%. The energy index was up 2.6% for the 12 months ending April while the food index increased 2.2%. The all items less food and energy index continued to be higher at 3.6% over the year, with notable increases including shelter at 5.5% and motor vehicle insurance at 22.6%. (That might explain why your car insurance seems higher!) Phoenix inflation, which has led the nation for much of the last two years, is now the lowest among all metropolitan areas. The April 12-month change for Phoenix was 2.6%, nearly a full percentage point lower than the nation. Phoenix overall inflation has consistently been lower than the national rate since October. –Valorie Rice
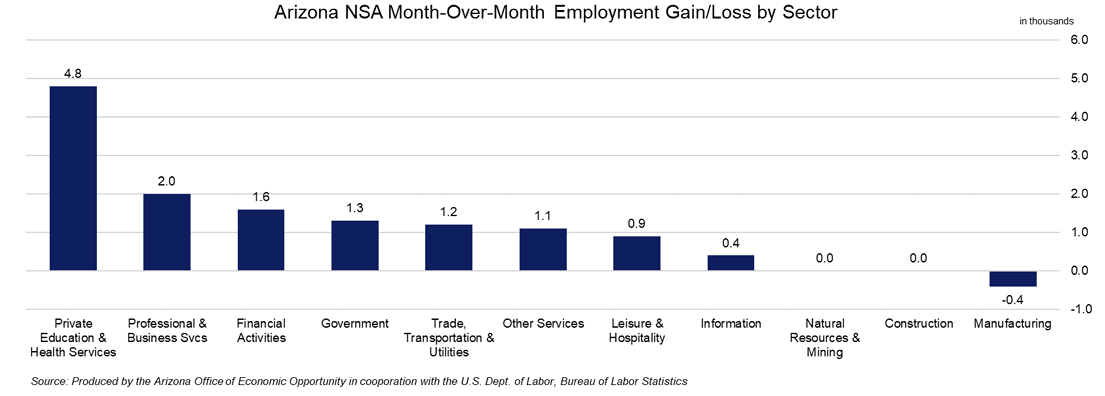
Total nonfarm employment in Arizona increased by 64,600 jobs over the year in April, with the seasonally adjusted unemployment rate decreasing by 0.2 percentage points to 3.6%. The U.S. seasonally adjusted rate increased to 3.9% from 3.8% in March. Arizona’s non-seasonally adjusted total nonfarm employment increased by 12,900 over the month, greater than the pre-pandemic average of 9,500. Employment gains were reported in private education & health services (4,800); professional and business services (2,000); financial activities (1,600); government (1,300); trade, transportation, & utilities (1,200); other services (1,100); leisure & hospitality (900); and information (400). Employment losses were reported in manufacturing (-400); no net changes were reported in natural resources & mining or construction. –Delaney O’Kray-Murphy
In April, over the month state unemployment rates were lower in 5 states, higher in 2 states, and stable in the remaining 43 and the District of Columbia. Arizona’s seasonally adjusted unemployment rate decreased 0.2 percentage points over the month to 3.6%. North Dakota and South Dakota had the lowest jobless rates in April at 2.0% each, followed by Vermont at 2.1%. California had the highest unemployment rate at 5.3%, followed by the District of Columbia at 5.2% and Nevada at 5.1%. Thirty states saw unemployment rate increases over the year, the largest being Rhode Island (+1.4 percentage points). Massachusetts had the only over-the-year rate decrease of 0.3 percentage point. Nineteen states and the District of Columbia had jobless rates that were not notably different from a year prior. Over the year, Arizona observed a 2.3% increase in seasonally adjusted employment, rising 73,100 to 3,260,600. –Delaney O’Kray-Murphy
According to the May 17th State Job Openings and Labor Turnover (JOLTS) report job, the openings rate decreased in nine states, increased in one state, and was little changed in all other states. Arizona was among the states with the largest decrease in job opening rates at -1.0% for March. The job openings rates for Arizona were 4.4% for March, 5.4% for February, and 4.2% for January. The number of job openings decreased in 12 states, increased in one state, and was little changed in all other states. The largest decrease in the number of job openings was seen in California (-119,000). The largest increase in the number of job openings was in New Jersey (+51,000). Hire rates decreased in six states, increased in one state, and little changed in all other states. New Jersey had the largest increase with +0.8%. The hire rates for Arizona were 3.5% for March, 3.7% for February, and 3.9% for January. The number of hires decreased in six states, increased in one state, and little changed in all others. Texas (-109,000) and North Carolina (-53,000) experienced the largest decreases in hiring levels. The number of layoffs and discharges decreased in seven states, increased in four states, and was little changed in all other states. The largest increase was seen in Pennsylvania (+29,000). Nationally, the layoffs and discharges rates and total separations rates were little changed. –Alex Jaeger
The Producer Price Index (PPI) for final demand rose 0.5% in April on an annual basis, seasonally adjusted. Final demand prices declined 0.1% in March and advanced 0.6% in February. On an unadjusted basis, the index for final demand increased 2.2% from April 2023 to April 2024. Nearly three-quarters of the April advance is due to a 0.6% increase in the index for final demand services; prices for final demand goods moved up 0.4%. The index for final demand less foods, energy, and trade services increased 0.4% in April after rising 0.2% in March; in the past 12 months, the index has risen 3.1%. The increase in the index for final demand services was led by a 0.6% rise in trade, transportation, and warehousing. The index for final demand goods rose 0.4% in April was led by a 2.0% increase in final demand energy. –Delaney O’Kray-Murphy
In April, Arizona’s over-the-year total building permits saw an impressive 25.5% increase to 5,357, not seasonally adjusted. The number of single-family permits similarly rose 44.8% over the year to 3,739. The Phoenix metropolitan area accounted for most of the permits in the state, with 4,109, a 25.0% increase. The number of single-family permits also saw significant gains, rising 39.6% to 2,615. The Tucson MSA experienced similar growth, with total permits rising 32.4% to 470, and single-family permits increasing 37.5% to 392. Of the counties, Apache, Gila, La Paz, Maricopa, Mohave, Navajo, Pima, and Pinal, saw increases, while Coconino, Graham, Santa Cruz, Yavapai, and Yuma saw decreases. No changes were observed in Cochise and Greenlee. –Delaney O’Kray-Murphy
Two Arizona cities reached population milestones in 2023 according to the U.S. Census Bureau city and town population estimates released on May 16. The city of Yuma crossed the 100,000 population mark and Prescott Valley bumped up past the 50,000 population mark in 2023. Phoenix remained the fifth largest city in the nation for 2023, just above Philadelphia. The South experienced the most significant population gains, specifically Texas which had eight of the top 15 fastest-growing cities. San Antonio, TX, gained the largest number of residents of any city between 2022 and 2023 while Celina, TX, near Dallas, grew by 26.6% compared to the national population growth rate of 0.5%. This population release also included housing unit counts. California had the largest number of housing units while Utah had the fastest growth in housing units, increasing 2.5% over the year. Nationally, the housing stock increased 1.1%. Maricopa had the second largest gain in housing units for counties between July 2022 and July 2023 just behind Harris County, TX, adding about 36,000 units each. –Valorie Rice
Author: The Economic and Business Research Center (EBRC).