Whether it’s for an economic opportunity or the need to find a better-suited home, moving is a common occurrence in America. And, while most people who move house tend to stay within the same general area, metro-to-metro migration trends produce noticeable population shifts within the country, which can define the way metros develop. And when it comes to metro-to-metro population growth, Phoenix is No. 1.
• Phoenix earned the first spot as the most popular metro for in-migration, gaining an average of 49,882 residents per year, from exchanges with other metros, between 2015 and 2019.
READ ALSO: Hispanic population is now the majority in Phoenix, Census shows
• Most of the new residents came from the three largest contributors: Los Angeles, Tucson, and Chicago.
• Mostly, people left from Phoenix to Tucson, Flagstaff, and Prescott.
• Overall, the Sun Belt continues to be a popular destination for Americans with locations like Inland Empire, Dallas, and Austin making the Top 10.
For instance, our previous analysis on metro-to-metro migration found that burgeoning Sun Belt economic centers with advantageous costs of living were gaining net population from exchanges with other metros. The U.S. Census Bureau has released the latest metro-to-metro migration data in September 2021, so we decided to find out how internal population movement had changed since our last study.
Sun Belt Metros Continue Winning Residents Through Metro-to-Migration

Similar to our previous report on in-migration, the Sun Belt maintained its status as a popular destination for Americans moving to a new metro area. Granted, select areas across the South and Southwest have the perfect mix of conditions to draw new residents: Warmer climates and more sunny days per year; employment opportunities in high-performance industries for fresh graduates; and lower rent and costs of living than some higher-density coastal areas. The last factor also means that these areas are potentially great for digital nomads and remote work — which will be a big draw in the post-pandemic world given that many companies are planning to shake up their work models.
#1 – Phoenix
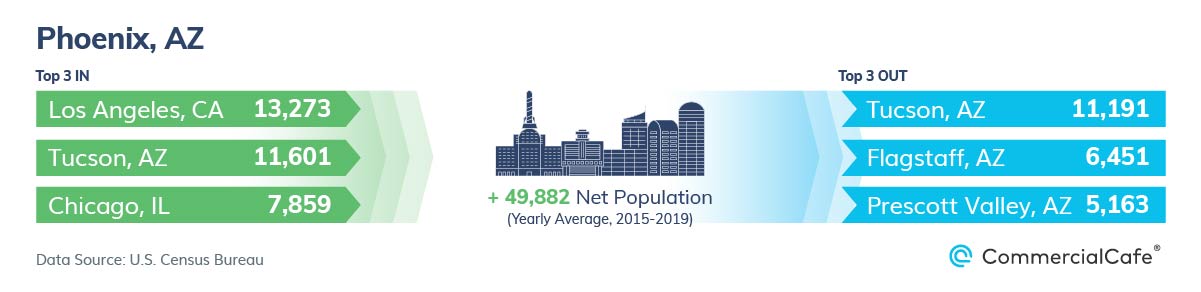
Phoenix held on to its title as the most popular metro for in-migration with an average of 49,882 residents per year gained from exchanges with other metros. The Valley of the Sun absorbed residents from across the country, with the three largest contributors being Los Angeles, Tucson and Chicago.
Phoenix nabbed the top spot in our previous ranking, as well, with a yearly net population gain of 42,869 between 2013 and 2017. This means that the metro’s population inflow has accelerated in the latter part of the decade. As always, the causes are multi-faceted, but the most common reasons for the sprawling metro’s growth are its relative affordability, tech boom driving demand for Phoenix office space and the metro’s popularity as a retirement destination — meaning that the metro can attract U.S. citizens of all ages from anywhere in the country.
#2 – Inland Empire
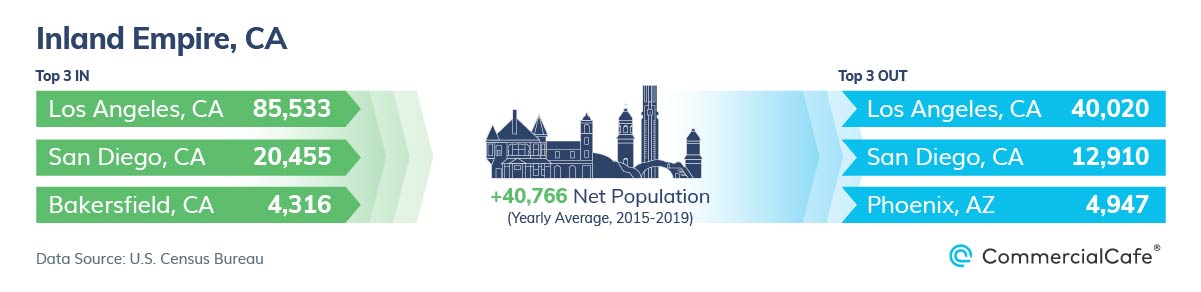
Inland Empire also held steady as the U.S. metro with the second-largest population absorption from metro-to-metro migration. In fact, it even accelerated its population gain by 5,000 residents per year compared to the last timeframe. Neighboring Los Angeles provided the metro with the majority of its new residents: Inland Empire gained 45,000 net residents per year from LA alone.
One of Inland Empire’s biggest draws is its lower cost of living compared to other Golden State metros. Notably, the transportation and warehousing industry here is a mainstay of the local economy. And, given the fact that jobs related to warehousing and logistics are among the fastest-growing in the nation, Inland Empire has the potential to continue being a magnet for metro-to-metro migration.
#3 – Dallas-Fort Worth
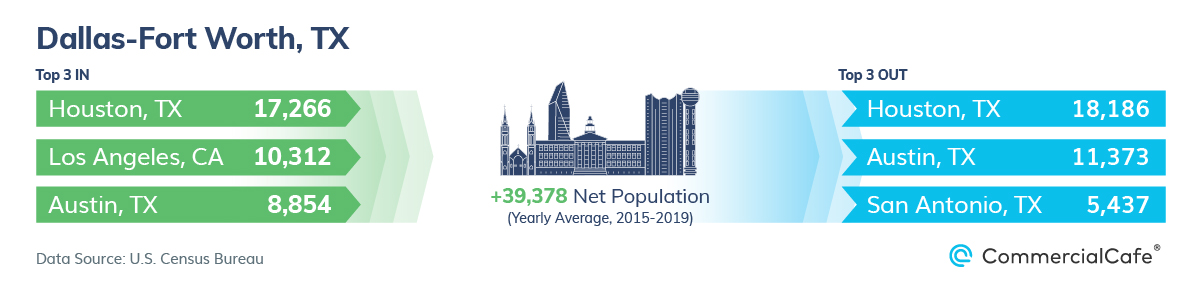
Dallas-Fort Worth occupied the last spot on the podium, with an average net gain of more than 39,000 residents per year between 2015 and 2019. Like the two other entries on the podium, DFW’s population absorption picked up momentum toward the end of the last decade.
The metro also pulled ahead of other in-state cities — including Houston, which was ranked third in our previous article, but fell just outside the top 10 this year. Individuals moving to the area from large metros outside the state — such as Los Angeles, New York City, San Francisco and Washington, D.C. — were the main cause of the metroplex’s population inflow, as DFW loses net population to both Houston and Austin.
A variety of aspects draw movers to the Lone Star State’s largest metro: The area boasts economic factors, such as a business climate that can accommodate both giants and startups, as well as employment opportunities in tech, healthcare, manufacturing and resource extraction. But, Dallas-Fort Worth is also one of the best metros for Gen Zers, with a young population and many options for higher education.
#4 – Austin
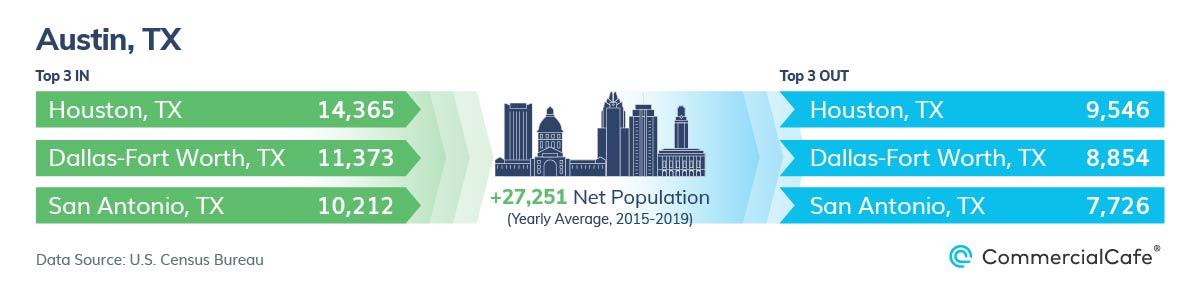
Gaining an average of 27,251 net residents per year from other metros, Austin reached the fourth spot on our list primarily by winning out in population exchanges with other Texas metros, including Houston, DFW and San Antonio. However, the metro is one of the hottest locations in the entire country for people looking to relocate. In fact, Austin’s population has a large share of Millennials, who are drawn by its availability of jobs, as well as its vibrant atmosphere.
But, Austin’s population is rapidly growing from other sources besides young professionals relocating: According to U.S. Census data, the metro’s overall population grew by as much as 33% between 2010 and 2020, making it the fastest-growing among the 50 largest metros in the U.S.
#5 – Las Vegas
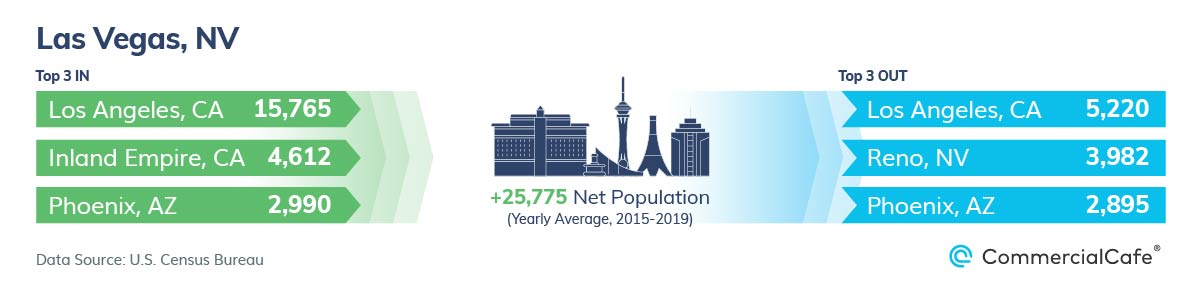
Las Vegas gained 25,775 residents per year from other metros between 2015 and 2019 — nearly 6,000 more residents per year compared to our previous study, meaning that population inflow accelerated considerably toward the end of the decade.
One of Vegas’ major draws is that it’s a more affordable option for residents moving from California metros, which are its main sources of metro-to-metro migration. However, the local economy — which now combines both the traditional entertainment industry and other, more diversified sectors, such as those driving demand for office space in Las Vegas — means that the metro also boasts economic opportunities for companies and employees.
#6 – Tampa
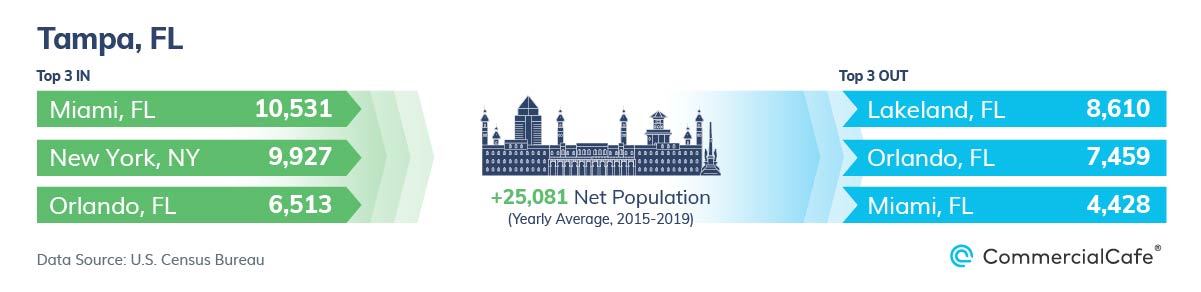
Florida recorded three entries on our list — the most of any state — and the highest-ranked among them was Tampa at #6, with a little more than 25,000 residents gained per year from other metros.
In addition to the Sunshine State’s status as a popular destination for retirees, job opportunities and economic factors also drive population absorption, especially from New York City. Here, industries such as professional and business services; finance and tech all drive employment in Tampa’s office spaces, potentially enticing prospective residents.
#7 – Jacksonville
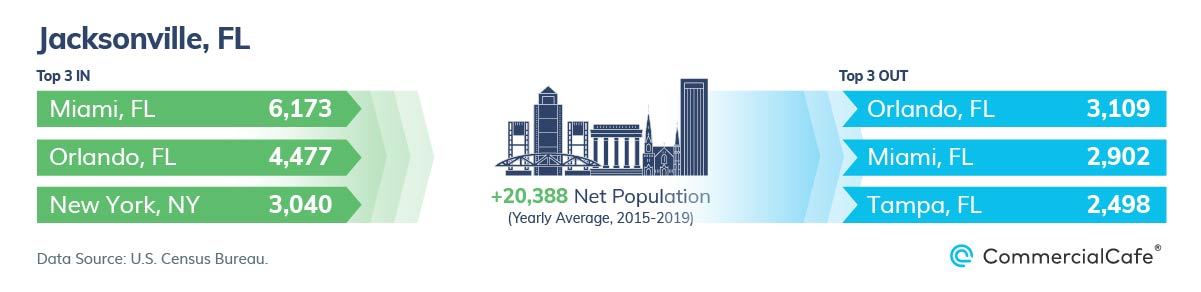
Next up on the list was Jacksonville — a new entry with a net influx of 20,388 residents per year from metro-to-metro migration. The combination of in-migration into Jacksonville and new residents gained from other sources meant that the metro reached a population of 1.6 million in 2020, according to U.S. Census data — a 19.3% increase from 2010’s 1.34 million.
Jacksonville benefits from a robust healthcare industry on top of a diversified mix of other industries. Plus, a well-developed tourism industry and affordable cost of living also contributed to the net influx of residents into Jax, with the primary sources of population being Miami; Orlando, Fla.; and New York City.
#8 – Orlando
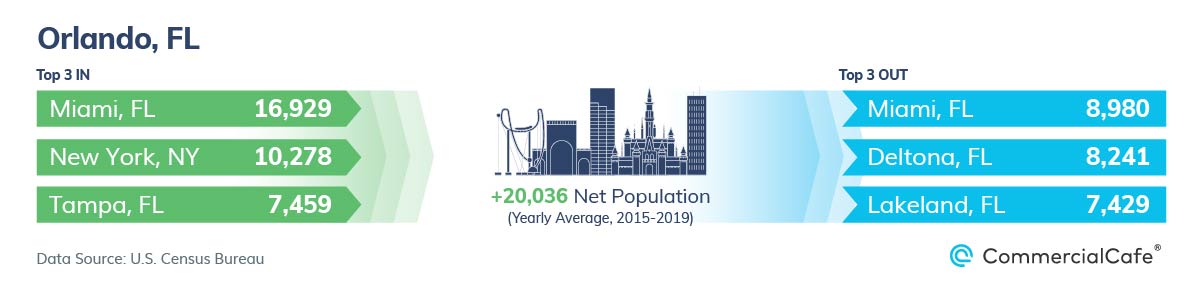
Orlando came in just behind Jacksonville with 20,036 residents gained per year through in-migration, with many people moving here from Miami and New York City.
With a similar business climate to Jacksonville, Orlando has plenty of draws besides its great weather. And, the metro’s diverse population also grew considerably from other sources, from 2.13 million in 2010 to 2.73 million in 2020 — a 25.3% increase — making it America’s second-fastest-growing metro in the last decade.
#9 – Charlotte
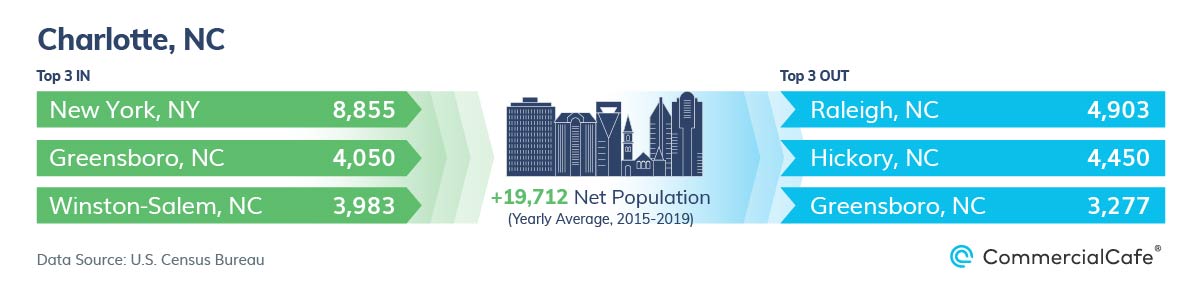
On average, Charlotte gained 19,712 residents from other metros between 2015 and 2019, which represented a small decrease from the 21,143 recorded in our previous study’s timeframe.
Even so, it’s still one of the fastest-growing metros in the country when factoring in other population sources. In fact, last decade, Charlotte was the ninth-fastest-growing large metro, by percentage, with a population increase of 18.6%. The metro will likely continue drawing residents from both Carolinas, as well as New York City — its primary source of residents moving in — especially considering its economic landscape that is ready for remote work.
#10 – Raleigh
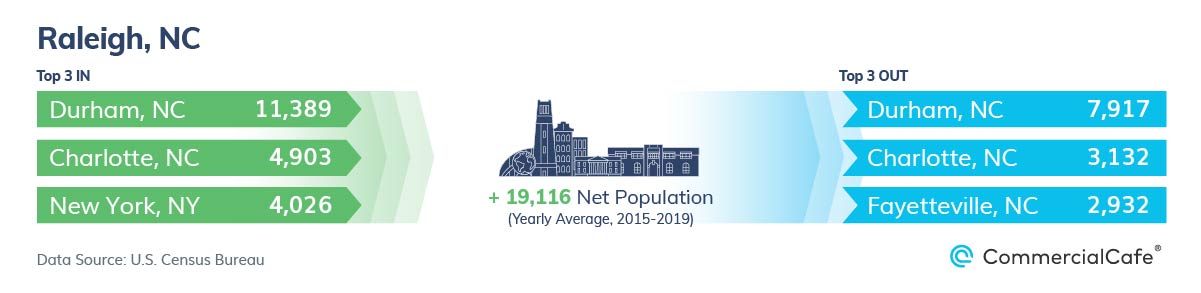
Raleigh closed out the top 10, gaining 19,166 residents per year, on average, between 2015 and 2019. The metro is popular for both relocations within North Carolina, as well as arrivals from other states.
Notably, previous CommercialCafe studies ranked the city as a prime option for both Gen Zers and Millennials, which is reflected in its population inflow. But, in addition to these demographics, Raleigh also gains residents from other sources, as its population grew by 25.1% between 2010 and 2020, reaching 1.41 million last year.
Although the pandemic may have initially called into question previous mobility trends, Americans are quickly picking up the pace. And, remote work and other economic shake-ups caused by COVID-19 have likely pushed Americans into the suburbs. However, the same Sun Belt economic hotspots that were winning in metro-to-metro migration prior to the pandemic will likely maintain their momentum or even see it accelerate as people look for better affordability, coupled with more high-end jobs that can function in remote or hybrid work models.
Methodology
- Yearly net population gain is calculated by deducting the number of residents lost to other metros between 2015 and 2019 from the number of residents gained from other metros between 2015 and 2019.
- We looked at migration between mainland U.S. metropolitan statistical areas.
- Metro-to-metro migration estimates for 2015-2019 were released by the U.S. Census Bureau in September 2021.
- Non-internal migration, as well as migration to or from places that are not part of a metropolitan area were excluded.
- Data on population growth from all sources between 2010 and 2020 was also provided by the U.S. Census Bureau.
- For each of the top 10 metros, the top three sources for in-migration into the metro and the top three destinations for in-migration out of the metro were highlighted.