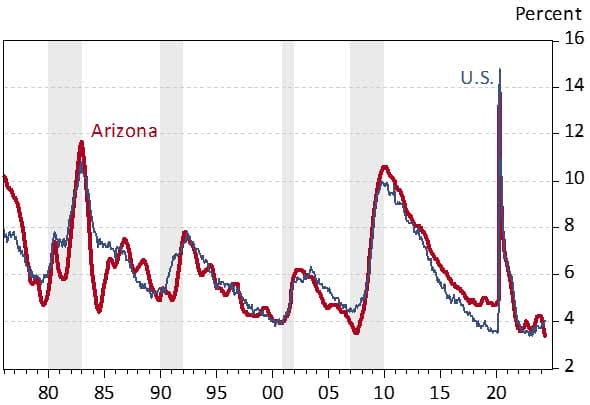
The Arizona labor market was historically tight in May. Arizona’s preliminary seasonally-adjusted unemployment rate dropped again in May, this time to 3.4%, an all-time low going back to 1976. The prior low was August 2007 at 3.5% (Exhibit 1). Arizona’s rate was also below the U.S. at 4.0%.
While the May rate was slightly below the prior low, it is important to note that the difference is not statistically significant and that the May rate is subject to revisions in coming months. The overall message from the latest data is that Arizona’s labor market remains tight. That is a double-edged sword. It means that employers are still struggling to find the labor that they need and when they do find it, they find themselves having to pay more for it. In contrast, workers face a labor market with abundant opportunities and rising wages.
Exhibit 1: Arizona and U.S. Unemployment Rates, Seasonally Adjusted, Percent

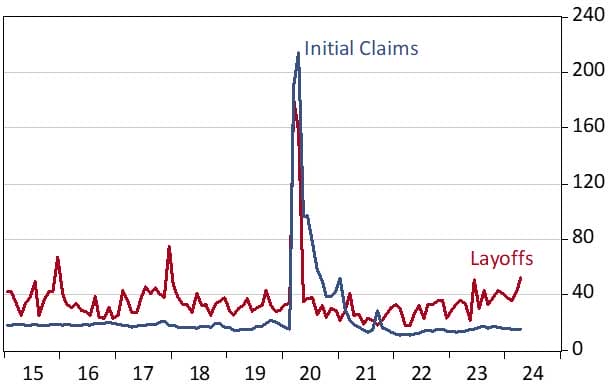
While the Arizona and U.S. labor markets remain tight, there are a few nascent signs of loosening. We are seeing modest upward trends in both Arizona initial claims for unemployment insurance and layoffs from the Job Openings and Labor Market Turnover Survey (JOLTS) (Exhibit 2).
Exhibit 2: Arizona Layoffs and Initial Claims for Unemployment Insurance, Seasonally Adjusted

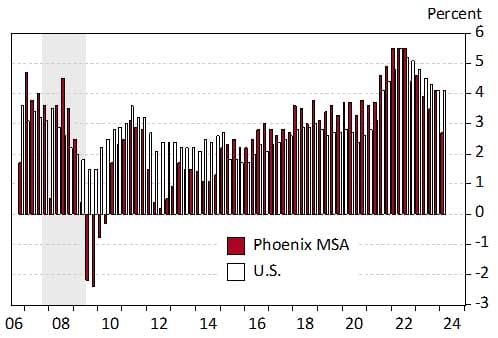
There are also small signs of loosening in the labor market in the employee compensation data. Private-sector employment costs are tracked by the U.S. Bureau of Labor Statistics’ Employment Cost Index. This tracks employee wages and salaries as well as fringe benefits. Data are published for the U.S. and large metropolitan areas, including the Phoenix MSA.
Exhibit 3 shows the latest trends in growth in the employment cost indexes for the U.S. and Phoenix. Growth in labor costs peaked during the summer of 2022 at 5.5% over the year for both Phoenix and the U.S. Since then cost growth has moderated substantially. For the first quarter of 2024, employment costs rose 2.7% for Phoenix and 4.1% nationally. The Phoenix increase in the first quarter was the slowest pace since the end of 2017.
Exhibit 3: U.S. and Phoenix MSA Private Sector Employment Cost Indexes, Over-the-Year Growth, Percent

Arizona added 4,400 jobs over the month in May (seasonally adjusted), down from a revised increase of 7,800 in April. The preliminary estimate put April gains at 9,800.
In May job gains were driven by private education and health services (up 2,600); trade, transportation, and utilities (up 1,600); financial activities (up 900); and manufacturing (up 700). Also adding jobs were construction (up 300); government (up 200); and other services (up 100).
On the other end of the spectrum, leisure and hospitality jobs fell 1,800. Information and natural resources and mining jobs fell by 100. Professional and business services jobs were unchanged over the month.
Over the year, Arizona added 63,900 jobs in May, which translated into 2.0% growth. That was above the U.S. pace of 1.8%. As Exhibit 4 shows private education and health services; trade, transportation, and utilities; and government contributed significantly to overall gains. Professional and business services; construction; other services; natural resources and mining; financial activities; and manufacturing jobs were also up over the year
In contrast, leisure and hospitality jobs were down 7,500 and information jobs were down 2,600.
Exhibit 4: Arizona Net Job Change (Thous.) and 2022 Annual Wages

The Phoenix MSA (Maricopa and Pinal counties) added 52,300 jobs over the year in May, for 2.2% growth. Phoenix accounted for 81.8% of statewide gains.
Tucson MSA jobs gains picked up some momentum in May, with growth of 1.3% (5,400 additional jobs). Tucson accounted for 8.5% of total statewide gains.
The Prescott MSA added 800 jobs over the year in May, for 1.1% growth.
Author: George W. Hammond, Ph.D., is the director and research professor at the Economic and Business Research Center (EBRC).


