
How common are workplace injuries in the U.S.? And which states see the most workplace accidents?
No matter how careful you may be, there’s no escaping the risk of having the occasional accident. Usually, these are nothing more serious than stubbing your toe, getting a papercut, or simply spilling your coffee. However, bad things can happen when you least expect them, and nobody is immune to injury.
READ ALSO: Here’s how supply chain disruptions are impacting Phoenix businesses
This made us at NiceRx consider the risk of injury at work, where we spend the majority of our time during the week. Workplaces can come with a whole host of risks that you wouldn’t otherwise encounter in your day-to-day life, and depending on your profession, an accident can be an extremely dangerous proposition.
With this in mind, we wanted to find out where in the US the most people are prone to serious workplace accidents. We’ve looked through official government statistics to identify the country’s top accident hotspots and reveal the people most at risk from a fatal accident at work.
Non-fatal occupational injuries by state
Here we compare the number of non-fatal workplace injuries in each state with their respective civilian labor force to present the number of accidents per 100,000 workers. How high is the rate in your state?
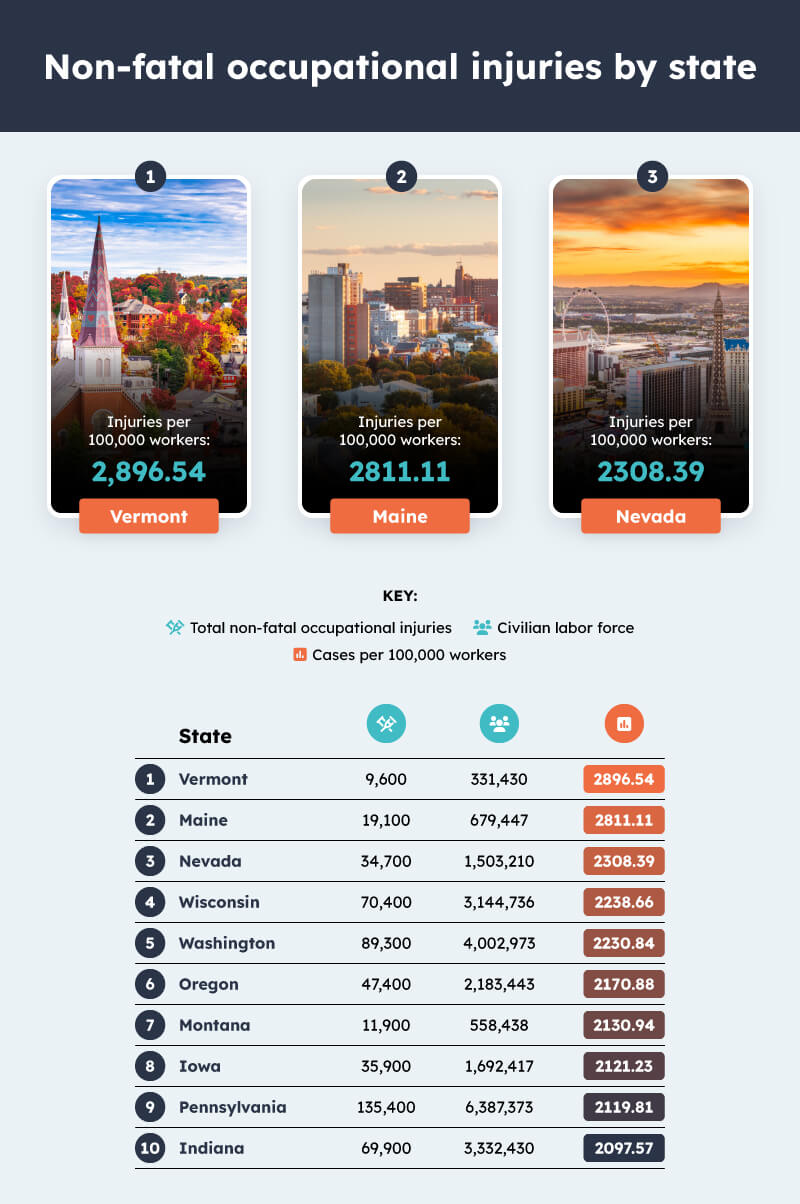
1. Vermont
Injuries per 100,000 workers: 2,896.54
Vermont has the accident-prone workforce of any state, with as many as 2,896.54 occupational injuries per 100,000 workers. The state is home to large manufacturing and agriculture industries, which could at least in part explain the very high accident rate. After all, it’s probably not entirely down to clumsiness.
2. Maine
Injuries per 100,000 workers: 2811.11
The state with the second highest rate of non-fatal workplace injuries is Maine, where there were 2,811.11 injuries per 100,000 workers. This could make the New England area seem like a particularly dangerous place to work, though no other state in the region has made the top ten.
3. Nevada
Injuries per 100,000 workers: 2308.39
In third place, with 2,308.39 injuries per 100,000 workers, is Nevada. In addition to agriculture and manufacturing, as well as the tourism industry that Nevada is perhaps most famous for, the state is home to a large mining industry, with the notoriously dangerous occupation potentially boosting the number of injuries.
Fatal occupational injuries by state
Unfortunately, not all accidents can be recovered from, and many people lose their lives each year while at work, through no fault of their own. In this section we will compare how the fatal workplace injury rates vary from state to state, and whether the most dangerous areas are the same for fatal and non-fatal accidents.
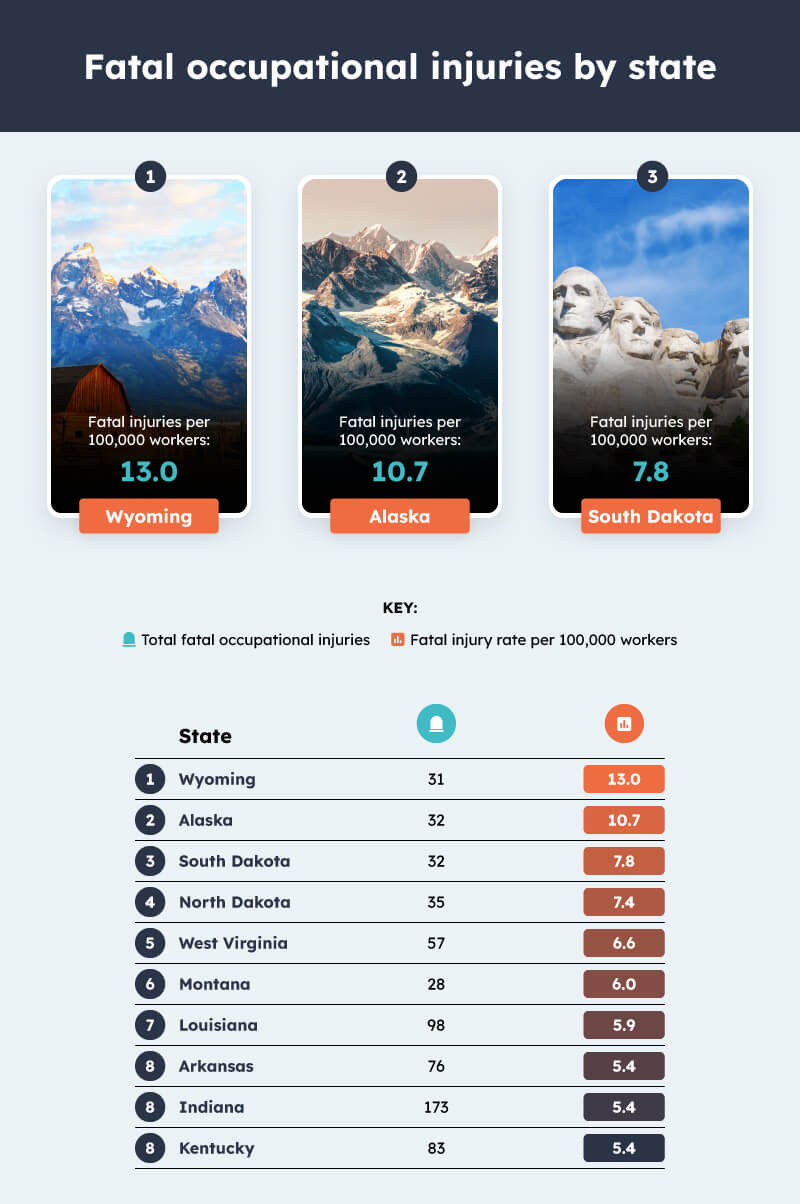
1. Wyoming
Fatal injuries per 100,000 workers: 13
Wyoming is the state where you’re most likely to have a fatal accident at work, with 13 fatalities for every 100,000 workers. While only 31 deaths were recorded across the state, Wyoming’s small population means the rate is actually much higher than it initially seems.
2. Alaska
Fatal injuries per 100,000 workers: 10.7
Alaska has the second highest rate of fatal occupational injuries at 10.7 per 100,000 workers. The rugged terrain, icy conditions and remoteness of much of Alaska brings with it additional risks that could have translated into a higher fatality rate.
3. South Dakota
Fatal injuries per 100,000 workers: 7.8
In third place is South Dakota, which recorded a workplace fatality rate of 7.8 deaths for every 100,000 workers. South Dakota is closely followed by North Dakota, which came fourth with a rate of 7.4, showing that the similarities between the states run much deeper than a shared name.
Fatal injuries by industry
Here we have ranked industries by the number of fatal occupational accidents that took place in each in 2018. As figures for the number of employees in each industry were not available, we have presented the data as a simple number of fatalities, rather than a rate per 100,000 workers.
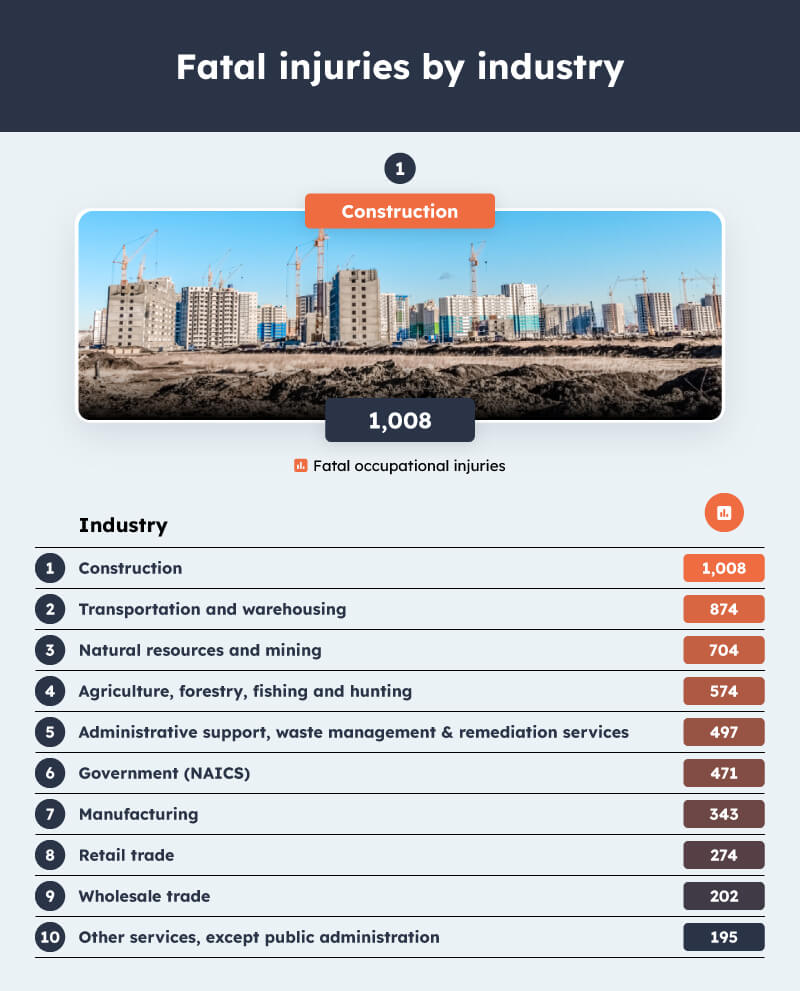
1. Construction
Fatal Occupational Injuries: 1,008
The construction industry is the most dangerous industry to work in in the United States with a total of 1,008 fatal occupational injuries in a single year. This is the only industry to exceed 1,000 fatalities, with the second most dangerous industry being transportation and warehousing at 874.
Fatal injuries by affected body part
This section examines which parts of the body are most commonly injured in a fatal workplace injury.
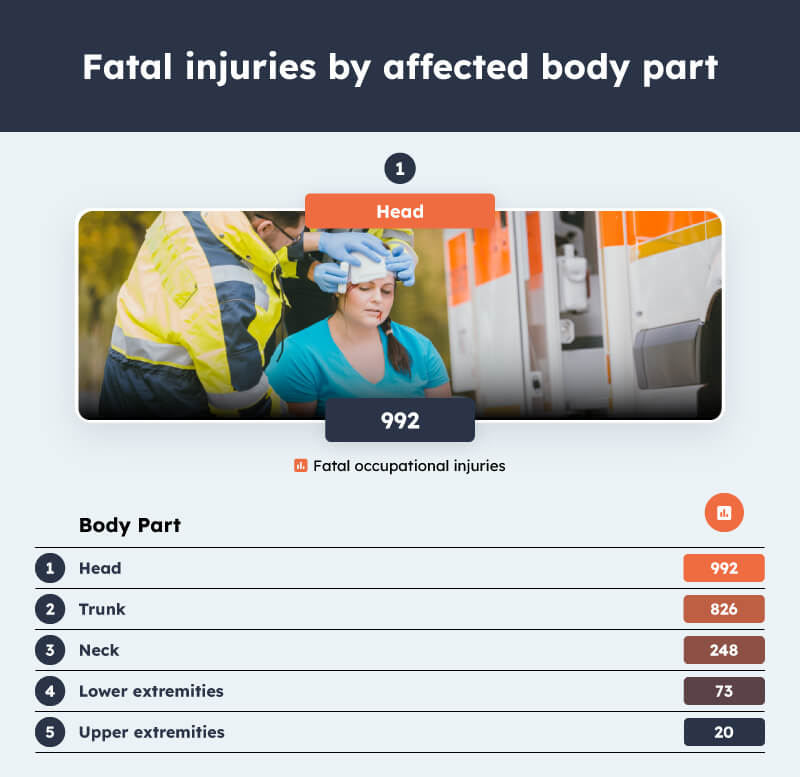
1. Head
Fatal Occupational Injuries: 992
The most common body part to be damaged in a fatal occupational injury is the head, with 992 fatalities. This is followed by the trunk, or torso, with 826 fatal injuries, and then by the neck with 248.
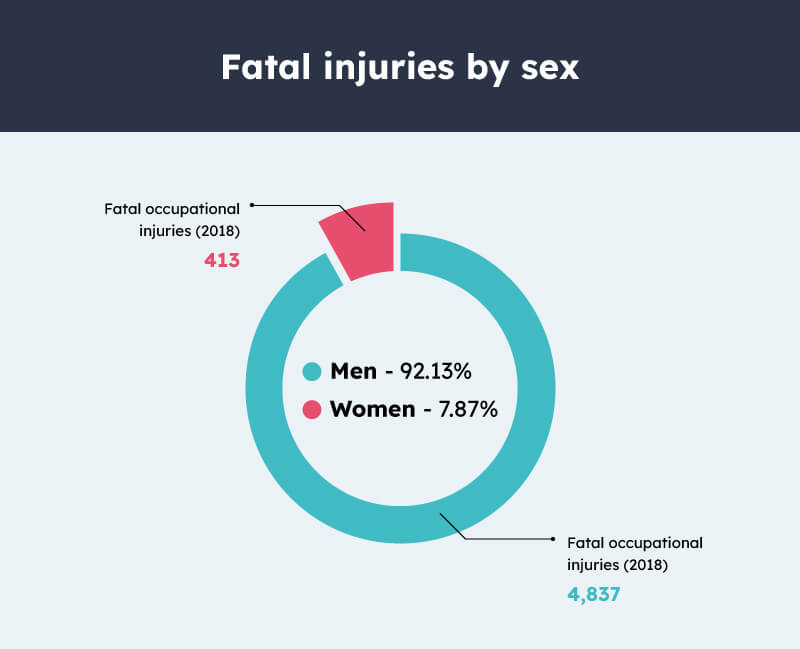
Fatal injuries by sex
There is also a big difference in the number of fatal workplace injuries between male and female workers. Men are much more likely to be the victim of a fatal injury at work, accounting for 92.13% of all cases. While men and women do have different habits and may behave differently in certain situations, this huge disparity is likely due to men being more commonly employed in dangerous industries such as construction, mining and commercial fishing.
Fatal injuries by age
Your age can also have a big impact on how likely you are to sustain a fatal injury in the workplace. Here’s how different age brackets compare for their total number of fatal occupational injuries.
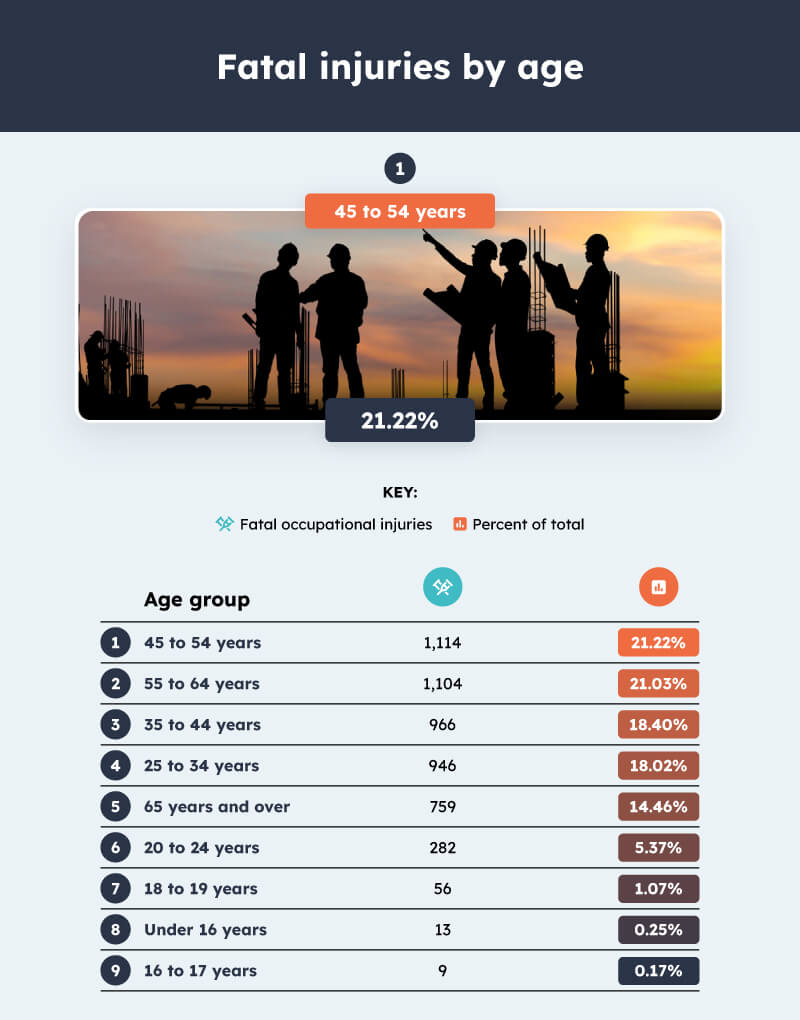
1. 45 to 54 years
Percent of Occupational Injuries: 21.22%
The most common age range for occupational injuries is people between the age of 45 and 54, accounting for 21.22% of all instances. This is closely followed by 55 to 64 year olds with 21.03% of total fatal injuries, suggesting that older workers are much more likely to have a fatal accident than their younger colleagues.
Fatal workplace injuries by day of the week
Here we can see the total number of fatal occupational injuries depending on the day of the week, revealing the most dangerous days for workers.
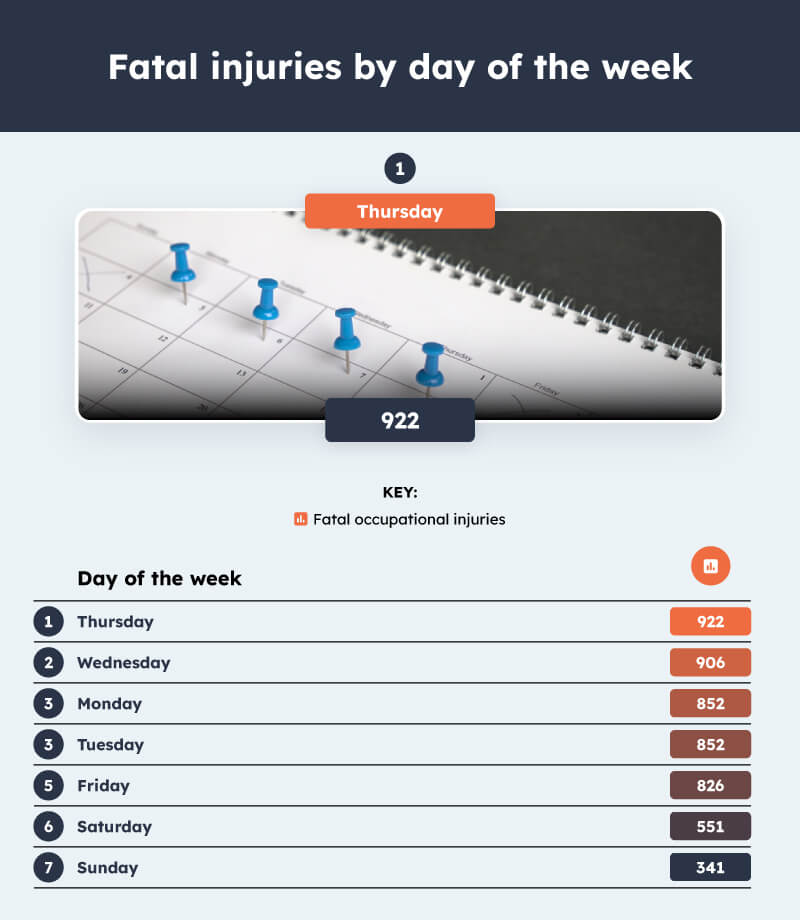
1. Thursday
Fatal Occupational Injuries: 922
Thursday is the most dangerous day of the week for fatal occupational injuries with 922 fatalities being recorded. This is closely followed by Wednesday on 906, while Monday and Tuesday are tied for third place on 852. Friday is the weekday with the lowest number of fatalities, while levels drop off significantly at the weekend while fewer people are at work.
Fatal injuries by month
We can also split the data by month, to reveal the time of year when fatal accidents are most likely to occur.
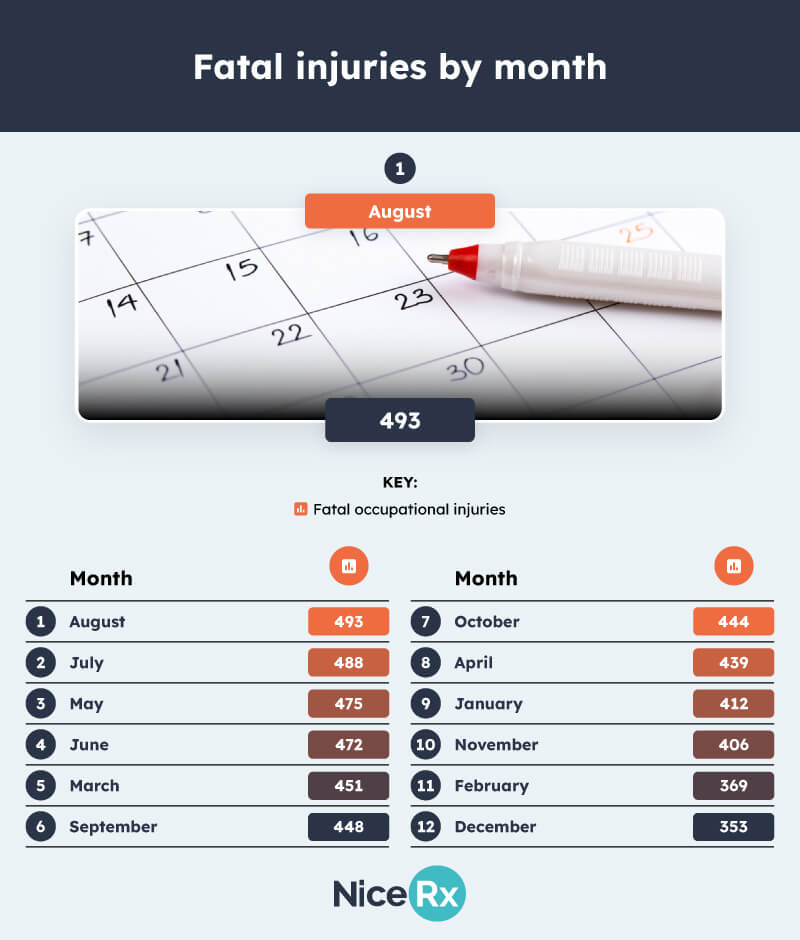
1. August
Fatal Occupational Industries: 493
August is the month when workers are most likely to suffer a fatal injury at work, with 493 recorded incidences. This is followed by July on 488, May on 475, and June on 472, indicating that the summer months are the most dangerous time of the year for accidents at work. This could be due to the hot weather making people tired and more clumsy, people being more relaxed and therefore paying less attention, or a combination of both.
Methodology
We wanted to find out where in the USA is the most accident-prone, as well as looking at various other accident trends in the country.
To do this, we used data from the Bureau of Labor Statistics that allowed us to see the breakdown of fatal and non-fatal occupational injuries across different states, as well as splitting the fatal occupational injury data by age, sex, day, month, industry and affected body part. This allowed us to reveal the most dangerous industries to work in, as well as when you’re most likely to sustain an injury and which groups are most at-risk.
Non-fatal injury data was not available for all 50 states, so our ranking for this type of injury does not cover the entire country. The states not included in this section are Colorado, Florida, Idaho, Mississippi, New Hampshire, North Dakota, Oklahoma, Rhode Island and South Dakota. A breakdown of non-fatal injury data by additional factors was also not available.