U.S. fertility rate has fallen to its lowest level in decades, with Arizona experiencing the 2nd largest decline, a 32.8% drop from 2005 to 2023. This trend is mirrored by neighboring states Utah and Nevada, which had the 1st and 3rd largest drops in fertility rates respectively.
While there are more births than deaths in Arizona, the same isn’t true for 21 states where a combination of low fertility rates and an aging population has led to more deaths than births. Arizona is among the top 20 states where births exceeded deaths.
We looked at fertility rates (or the number of births per 1,000 women ages 15 to 44) across each state. Here’s what we found.
LOCAL NEWS: 100 best places to work and live in Arizona for 2025
INDUSTRY INSIGHTS: Want more news like this? Get our free newsletter here
Key findings
- The U.S. fertility rate declined by 18.4% between 2005 and 2023. In 2005, there were 66.7 births per 1,000 women ages 15 to 44. That fell to 54.4 in 2023.
- Utah experienced the largest fertility rate decline in the studied period. In 2005, there were 92.8 births per 1,000 women in Utah, which fell 35.8% to 59.6 in 2023. Despite the biggest decline, the state had the eighth-highest fertility rate in 2023. Fellow Western states Arizona (32.8%) and Nevada (31.3%) had the next biggest declines.
- Southern states generally had the smallest fertility rate declines. Louisiana ranked first, with fertility rates falling just 2.6%. Notably, it tied for the sixth-highest fertility rate in 2023. North Dakota (4.3%) and Kentucky (7.1%) had the next smallest declines. In total, four of the five states with the smallest drops were in the South.
- More narrowly, just one state didn’t experience a fertility rate decline between 2022 and 2023. North Dakota was the only exception, where the rate remained the same. Meanwhile, Maine (5.4%), Delaware (5.1%) and Vermont (5.0%) saw the biggest decreases during this period.
- Deaths outpaced births in 21 states. Pennsylvania saw the biggest discrepancy between births and deaths in 2022 — the latest available year for both data points. That year in the state, there were 147,181 deaths and 130,252 births, or 16,929 more deaths. Florida (14,686) and West Virginia (10,578) had the next biggest surpluses in deaths.
U.S. fertility rate falls 18.4%
Between 2005 and 2023, the U.S. fertility rate fell by 18.4%. To give context, there were 66.7 births per 1,000 women ages 15 to 44 in 2005. That fell to 54.4 in 2023 — the lowest in the analyzed period.
Fertility rate by year
| Year | Fertility rate |
|---|---|
| 2023 | 54.4 |
| 2022 | 56.0 |
| 2021 | 56.3 |
| 2020 | 56.0 |
| 2019 | 58.3 |
| 2018 | 59.1 |
| 2017 | 60.3 |
| 2016 | 62.0 |
| 2015 | 62.5 |
| 2014 | 62.9 |
| 2013 | 62.5 |
| 2012 | 63.0 |
Show All Rows
Source: ValuePenguin analysis of Centers for Disease Control and Prevention (CDC) data. Note: The fertility rate is births per 1,000 women ages 15 to 44.
According to ValuePenguin health insurance expert Divya Sangameshwar, child care costs hinder a lot of Americans from having kids. In fact, a recent LendingTree report found that the cost of raising a child rose 35.7% over two years alone.
“The rising cost associated with having a child, combined with inflation and job insecurity, could prompt families to delay or forego having children,” she says. “For women who don’t have adequate insurance coverage, the costs associated with pregnancy, childbirth and postnatal care will set them more than $18,000 for a vaginal delivery. Even with insurance coverage, the average cost of giving birth is $6,940. These high costs are also a deterrent to having children.”
According to the Pew Research Center, changes in fertility rates can also be attributed to cultural changes, including Americans delaying or forgoing marriage. As women put off marriage, the birth rate for single women is less than half that of married women. Women are also putting off having children until later or forgoing having children altogether.
Meanwhile, teen fertility rates also play a large role. Teen fertility has fallen dramatically, decreasing from 21.1 in 2005 to 6.7 in 2019 among those ages 15 to 17 (the latest year of data available for this demographic). Pew largely attributes this to an increase in birth control and contraceptive use and general pregnancy prevention education.
Western states saw biggest drop in fertility rates
By state, Utah saw the biggest fertility rate drop. Here, fertility rates fell 35.8% from 92.8 in 2005 to 59.6 in 2023. Still, it’s worth noting that the state had the eighth-highest fertility rate in 2023.
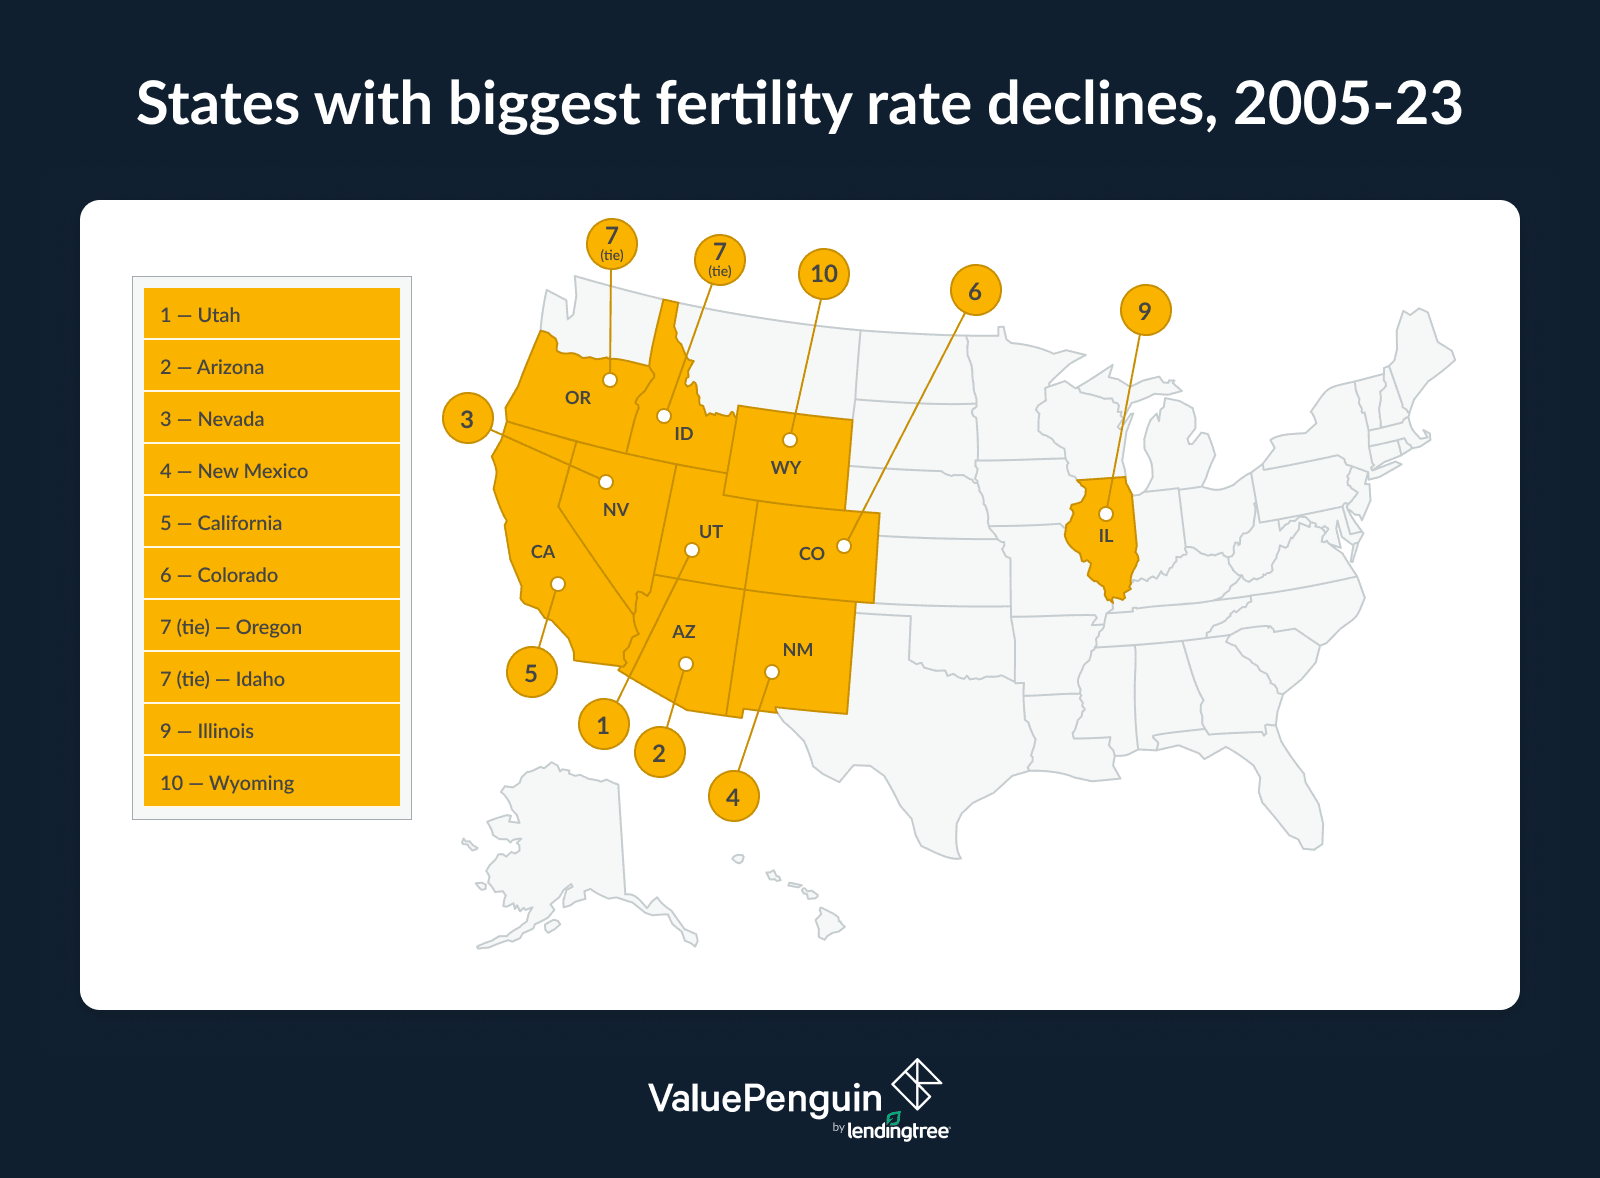
Arizona (32.8%) followed, with the fertility rate falling from 80.6 to 54.2. Nevada (31.3%) rounded out the top three, dropping from 73.9 to 50.8. Unlike Utah, both states had 2023 fertility rates slightly below the national rate of 54.4.
Full rankings: Change in fertility rates, 2005-23 (by state)
| Rank | State | 2005 fertility rate | 2023 fertility rate | % change |
|---|---|---|---|---|
| 1 | Utah | 92.8 | 59.6 | -35.8% |
| 2 | Arizona | 80.6 | 54.2 | -32.8% |
| 3 | Nevada | 73.9 | 50.8 | -31.3% |
| 4 | New Mexico | 73.0 | 51.5 | -29.5% |
| 5 | California | 70.5 | 50.4 | -28.5% |
| 6 | Colorado | 69.6 | 50.2 | -27.9% |
| 7 | Oregon | 62.9 | 45.9 | -27.0% |
| 7 | Idaho | 78.9 | 57.6 | -27.0% |
| 9 | Illinois | 67.0 | 50.4 | -24.8% |
| 10 | Wyoming | 71.4 | 54.5 | -23.7% |
| 11 | Georgia | 71.4 | 54.9 | -23.1% |
| 12 | Texas | 77.4 | 60.6 | -21.7% |
| 13 | Rhode Island | 55.6 | 45.2 | -18.7% |
| 14 | Montana | 64.0 | 52.2 | -18.4% |
| 14 | Washington | 63.0 | 51.4 | -18.4% |
| 16 | Hawaii | 69.2 | 56.9 | -17.8% |
| 17 | Oklahoma | 71.7 | 59.1 | -17.6% |
| 18 | Delaware | 65.3 | 54.4 | -16.7% |
| 19 | Kansas | 71.3 | 59.5 | -16.5% |
| 20 | Virginia | 64.0 | 53.6 | -16.3% |
| 21 | Florida | 64.3 | 53.9 | -16.2% |
| 22 | Vermont | 50.2 | 42.1 | -16.1% |
| 23 | Minnesota | 66.3 | 55.7 | -16.0% |
| 24 | North Carolina | 66.6 | 56.0 | -15.9% |
| 25 | Michigan | 61.9 | 52.2 | -15.7% |
| 26 | Alaska | 73.9 | 62.4 | -15.6% |
| 27 | Missouri | 65.9 | 55.8 | -15.3% |
| 28 | Massachusetts | 55.9 | 47.4 | -15.2% |
| 29 | Arkansas | 69.5 | 59.2 | -14.8% |
| 30 | Connecticut | 58.8 | 50.2 | -14.6% |
| 31 | Nebraska | 73.1 | 62.5 | -14.5% |
| 32 | Wisconsin | 62.5 | 53.6 | -14.2% |
| 33 | Mississippi | 68.7 | 59.2 | -13.8% |
| 34 | New Hampshire | 54.1 | 46.8 | -13.5% |
| 35 | Maine | 54.3 | 47.0 | -13.4% |
| 36 | South Carolina | 64.3 | 55.8 | -13.2% |
| 37 | Maryland | 62.0 | 54.1 | -12.7% |
| 38 | South Dakota | 74.7 | 65.6 | -12.2% |
| 39 | Indiana | 67.0 | 58.9 | -12.1% |
| 40 | New York | 59.9 | 52.7 | -12.0% |
| 41 | Iowa | 66.9 | 59.0 | -11.8% |
| 42 | Pennsylvania | 58.5 | 51.9 | -11.3% |
| 43 | Ohio | 63.5 | 56.4 | -11.2% |
| 44 | West Virginia | 59.2 | 53.1 | -10.3% |
| 45 | New Jersey | 63.7 | 57.4 | -9.9% |
| 46 | Tennessee | 65.2 | 58.9 | -9.7% |
| 47 | Alabama | 63.6 | 57.9 | -9.0% |
| 48 | Kentucky | 65.0 | 60.4 | -7.1% |
| 49 | North Dakota | 64.8 | 62.0 | -4.3% |
| 50 | Louisiana | 62.0 | 60.4 | -2.6% |