The Los Angeles-Long Beach-Anaheim MSA contributed the most domestic migrants to both Tucson and Phoenix. So, who else is moving to and from the Phoenix and Tucson metros?
MORE NEWS: 4 Valley cities rank among 50 safest and most affordable U.S. cities
As one of the fastest-growing states in the U.S., Arizona continues to draw significant numbers of new residents, reshaping its demographic and economic landscape. According to Public Use Microdata Series (PUMS) 5-year American Community Survey (ACS) data from Integrated Public Use Microdata Series (IPUMS) USA, in 2022 alone, 281,285 individuals migrated to Arizona from other states and the District of Columbia, while 199,673 residents left, resulting in a net domestic migration gain of 81,612. With Arizona ranking 4th for domestic net migration, this influx of new residents highlights the state’s growing appeal to workers and retirees.
Moving to Phoenix and Tucson
Tucson and Phoenix, Arizona’s largest cities, play a central role in this migration pattern, attracting skilled workers across the U.S.
IPUMS USA only releases data where the errors are sufficiently low. Of the 387 Metropolitan Statistical Areas (MSAs) in the 50 states and the District of Columbus, Arizona MSA out-migration data are available for 281 MSAs, while in-migration data are available for 266. The dark grey regions in the map exhibits represent unreported or unavailable data, while the light grey areas represent non-metropolitan core-based statistical areas (CBSAs). Data are not reported in Arizona for increased readability.
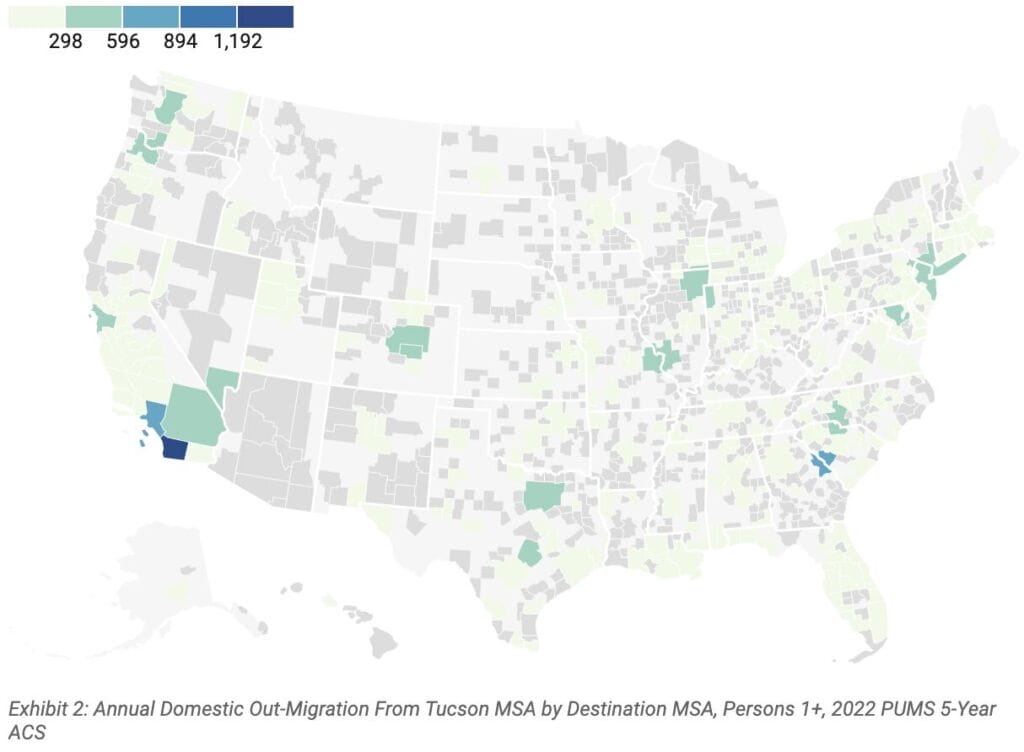
Tucson, the second largest city in Arizona, emerges as a significant hub for economic activity and cultural exchange in the region. The Tucson MSA attracted 26,371 individuals from non-Arizona metros, while 17,630 people left the Tucson MSA for other non-Arizona metros. Exhibits 1 and 2 illustrate the domestic inflows and outflows of residents between Tucson and other non-Arizona MSAs in 2022. Notably, the Los Angeles-Long Beach-Anaheim MSA sent the most domestic migrants to Tucson, 2,752, while San Diego-Carlsbad received the most, with 1,490. Tucson primarily drew migrants from Southern California but also received people from major northern and eastern MSAs, including Seattle, New York, and Chicago.
Exhibit 1: Annual Domestic In-Migration to Tucson MSA by MSA of Origin, Persons 1+, 2022 PUMS 5-Year ACS
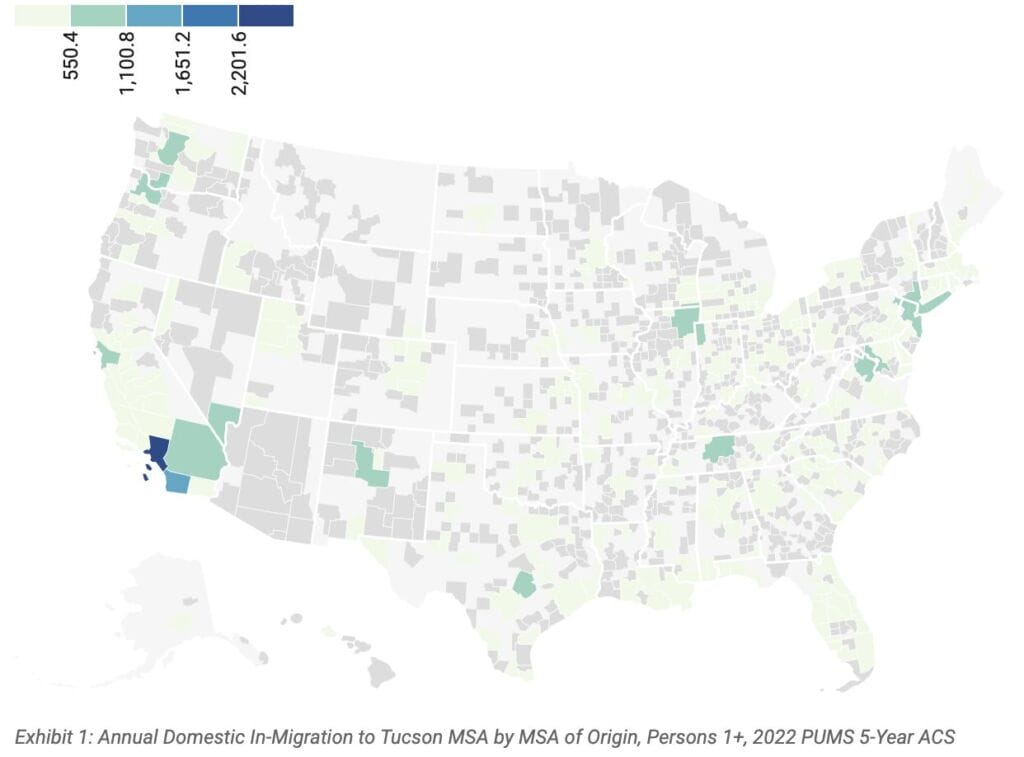
Exhibit 2: Annual Domestic Out-Migration From Tucson MSA by Destination MSA, Persons 1+, 2022 PUMS 5-Year ACS
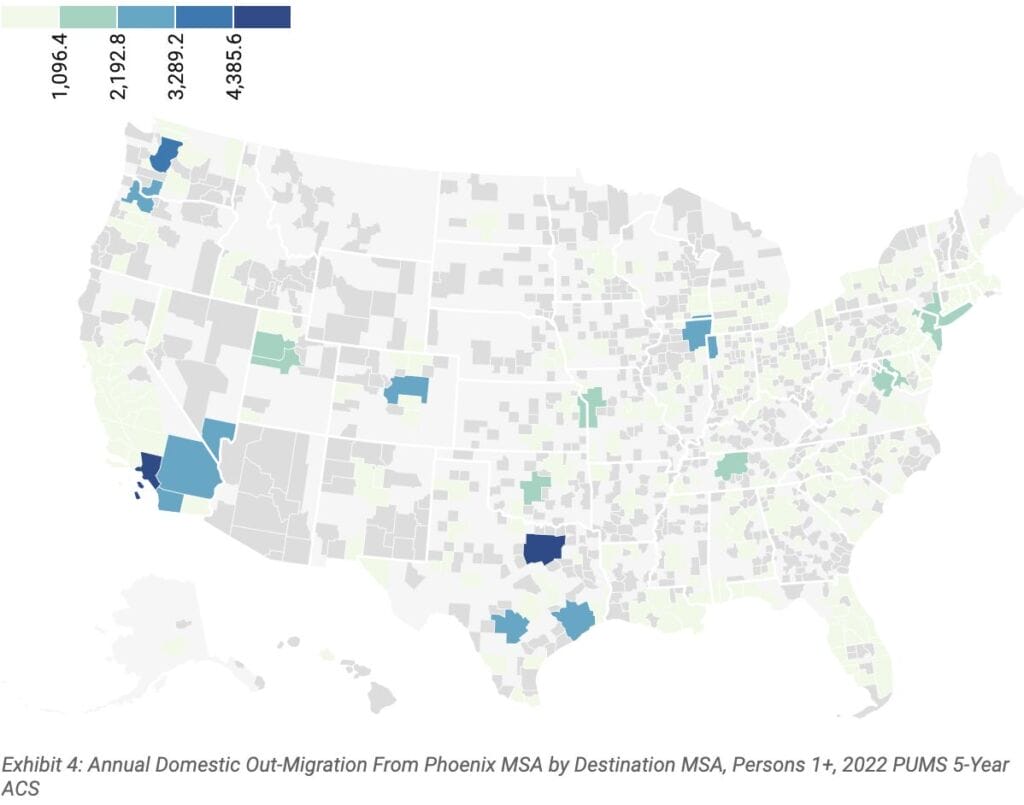
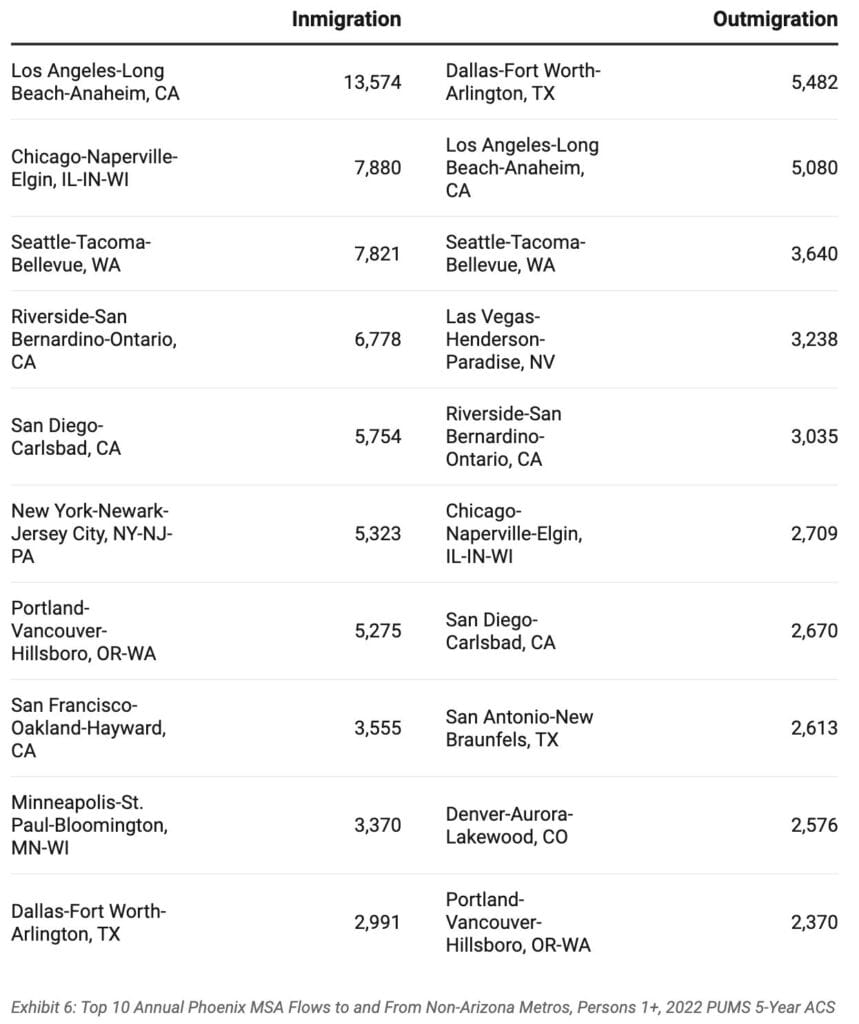
Phoenix, Arizona’s capital and largest city, stands as an important economic powerhouse in the Southwest, connecting Mexico to the U.S. as a crucial link in cross-border commerce. The Phoenix MSA attracted 133,610 individuals from non-Arizona MSAs, while 90,345 people left Phoenix for other metros. Exhibits 3 and 4 illustrate the domestic inflows and outflows of residents between Phoenix and other non-Arizona MSAs in 2022. Notably, the Los Angeles-Long Beach-Anaheim MSA contributed the most domestic migrants to Phoenix, with 13,574; the Dallas-Fort Worth-Arlington MSA received the most domestic out-migrants from Phoenix, totaling 5,482. These exhibits highlight an eastern population movement, as individuals migrate from Southern California to Phoenix, and from Phoenix to Dallas and other Texas MSAs.
Exhibit 3: Annual Domestic In-Migration to Phoenix MSA by MSA of Origin, Persons 1+, 2022 PUMS 5-Year ACS
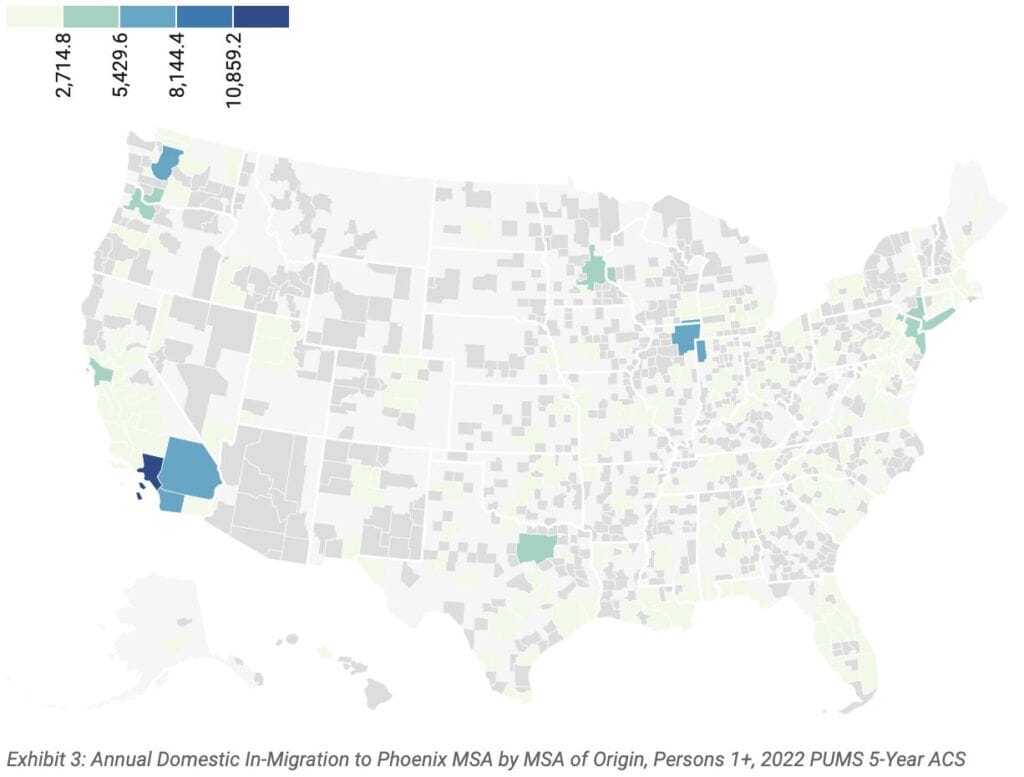
Exhibit 4: Annual Domestic Out-Migration From Phoenix MSA by Destination MSA, Persons 1+, 2022 PUMS 5-Year ACS
IPUMS harmonizes and provides access to high-quality data crucial for analyzing migration patterns and demographic trends. Through careful standardization of various sources, IPUMS enables researchers to examine the direction and volume of migration between regions, such as Tucson and Phoenix. IPUMS also provides additional variables describing geography that are not available in the original census files. However, data are not released for areas with sufficiently large errors, so not all geographies are represented. Despite these limitations, IPUMS provides valuable insights for urban planning and economic development. Exhibits 5 and 6 outline the top 10 MSA flows for for people moving to Phoenix and Tucson, respectively, excluding those that begin or end within Arizona.
Exhibit 5: Top 10 Annual Tucson MSA Flows to and From Non-Arizona Metros, Persons 1+, 2022 PUMS 5-Year ACS
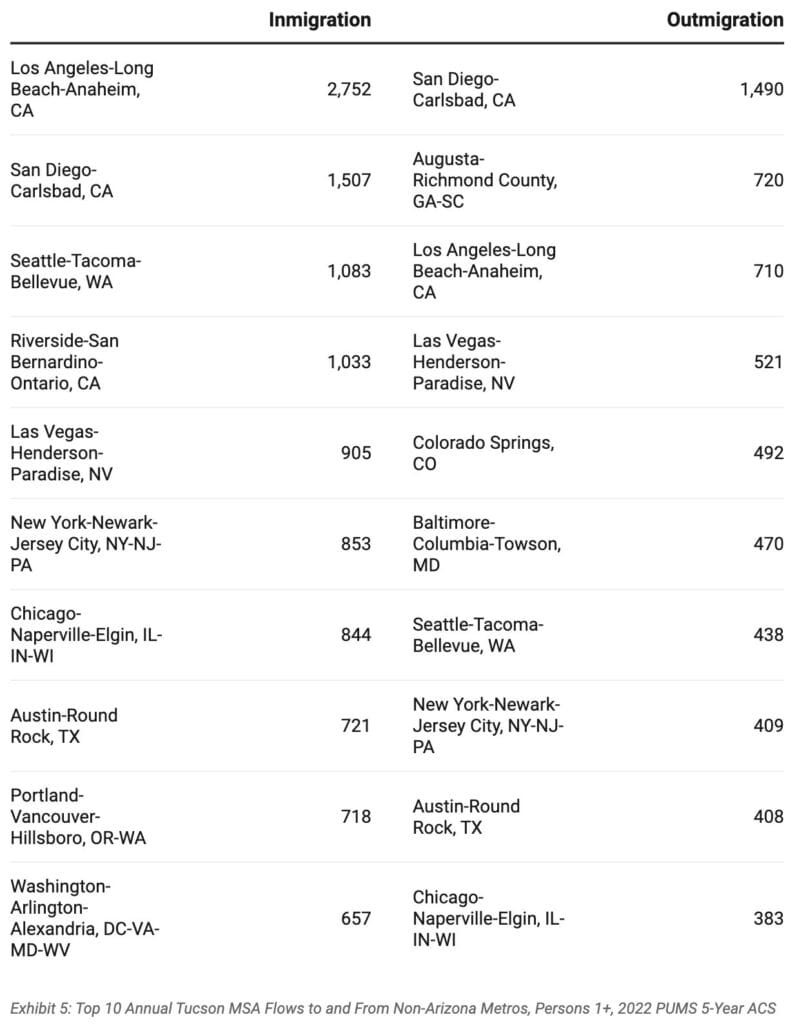
Exhibit 6: Top 10 Annual Phoenix MSA Flows to and From Non-Arizona Metros, Persons 1+, 2022 PUMS 5-Year ACS
Author: This story was written by Delaney O’Kray-Murphy, an EBRC research economist.


