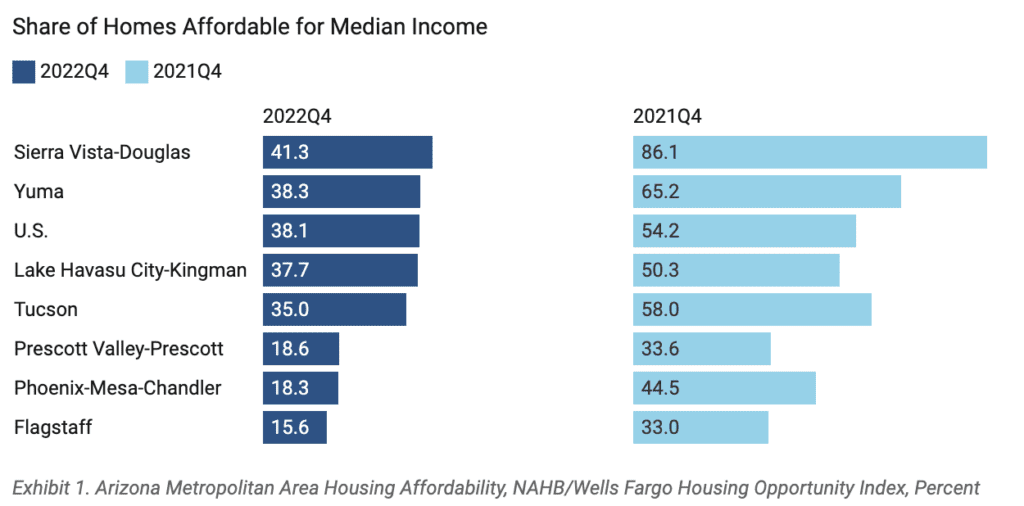
Housing affordability dropped to a new low nationally and in Arizona during the fourth quarter of 2022. The National Association of Home Builders/Wells Fargo Housing Opportunity Index, released February 9, indicated that only 38.1% of new and existing homes sold in the fourth quarter of 2022 were affordable to a family earning the U.S. median income. This was the third straight quarter of decreasing affordability for the nation, and declines were attributed to higher mortgage rates along with higher construction costs. The index reflects the share of homes sold in an area that would have been affordable to a family earning the local median income based on standard mortgage underwriting criteria. Arizona metropolitan areas experienced their lowest affordability since 2012 and only two were higher than the nation for the last quarter of 2022. They were Sierra Vista-Douglas and Yuma at 41.3% and 38.3%, respectively. To put this in context, these two places had shares of 86.1% and 65.2% in the fourth quarter of 2021 (Exhibit 1). Those with lower Arizona housing affordability than the nation were: Lake Havasu City-Kingman at 37.7%, Tucson at 35.0%, Prescott Valley-Prescott at 18.6%, Phoenix at 18.3%, and Flagstaff at 15.6%. The areas with the lowest affordability in the nation for the fourth quarter were all in California, with Los Angeles coming in last at just 2.2%. The most affordable area in the nation was Bay City, Michigan at 88.5%.
Exhibit 1. Arizona Metropolitan Area Housing Affordability, NAHB/Wells Fargo Housing Opportunity Index, Percent
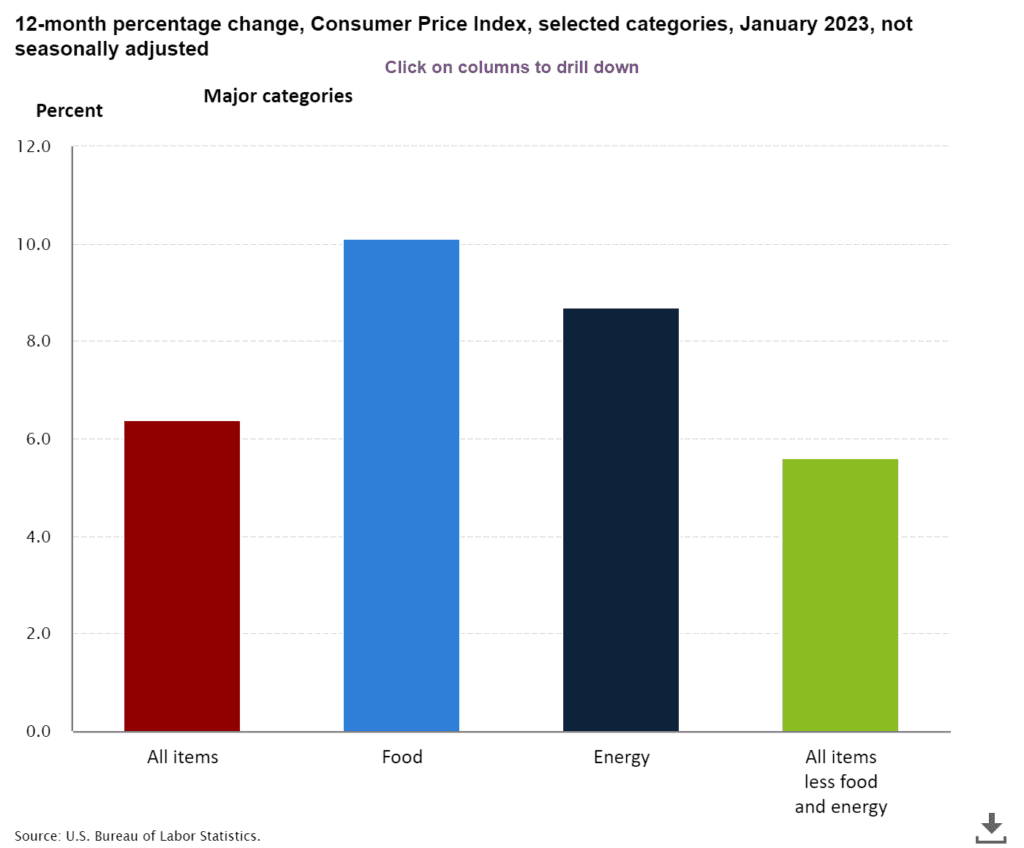
The U.S. Consumer Price Index for All Urban Consumers (CPI-U) rose 0.5% in January on a seasonally adjusted basis after increasing 0.1% in December. Shelter was the largest contributor, accounting for nearly half of the monthly all items increase. Food prices increased by 0.5% over the month while energy increased by 2.0%. The index for all items less food and energy rose 0.4% for the month according to the February 14 U.S. Bureau of Labor Statistics release. Annual inflation increased by 6.4% in January, as shown in Exhibit 2. This was the smallest 12-month increase since the period ending October 2021. The all items less food and energy index rose 5.6% over the last 12 months, its smallest 12-month increase since December 2021. The food index increased 10.1% and the energy index rose 8.7% over the last year for January.
Exhibit 2: U.S. Consumer Price Index, 12-Month Percentage Change, January 2023
U.S. producer prices also posted a monthly increase and a 12-month decrease. The producer price index increased 0.7% over the month in January, seasonally adjusted. Final demand services increased 0.4% while final demand goods were up 1.2% for the month based on the February 16 Producer Price Index release from the U.S. Bureau of Labor Statistics. A sizable portion of the January increase for goods was attributed to gasoline prices. The 12-month change in producer prices for January was 6.0% on an unadjusted basis. This was the seventh consecutive month of lower year-over-year change in final demand (keeping in mind that all indexes are subject to revisions up to four months after original publication).
There were 630 bankruptcy filings in Arizona for January, fewer than last January’s figure of 641. This was the smallest January figure since 2007 (Exhibit 3). The number of Chapter 11 (reorganization) filings was up over the same period last year, all other forms had fewer filings. The Phoenix office was 0.4% over January of last year while the Yuma office had the same amount as last year and Tucson filings decreased by 7.7%. The decrease for the Tucson office represented fewer bankruptcies in Pima, Pinal, Santa Cruz, and Greenlee counties over the same period last year, while Cochise and Graham counties were unchanged.
Exhibit 3. Monthly Arizona Bankruptcies by District
Impacting Arizona housing affordability, November house prices for Phoenix had a one-year increase of 6.3%, several percentage points lower than the October one-year gain of 9.6%, indicating continued easing of house prices. Nationally, the S&P CoreLogic Case-Shiller Index reported a 7.7% annual gain in prices in its January 31 release. This was down from 9.2% the previous month. The 20-city composite was also lower for November at 6.8% compared to 8.6% in October. Florida cities of Miami and Tampa were once again the places with the largest over the year increase in house prices for November while San Francisco dipped into negative territory with a 1.6% decline in house prices over the year.
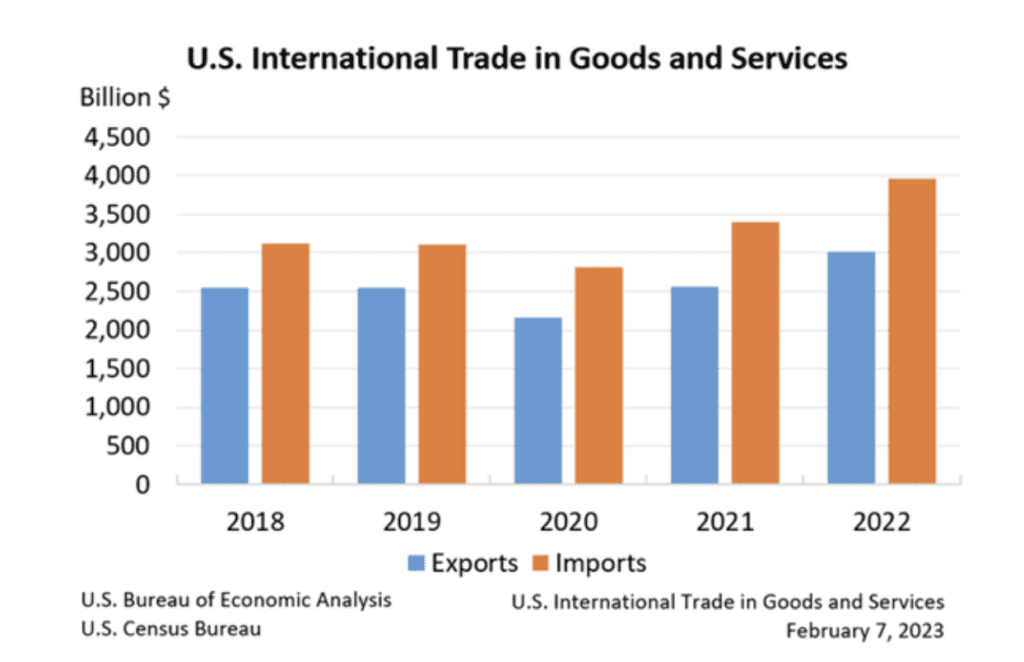
The U.S. trade deficit was $67.4 billion in December, up from a revised November figure of $61.0 billion. Exports were $250.2 billion and imports were $317.6 billion for the month based on the joint U.S. Census Bureau and U.S. Bureau of Economic Analysis February 7 release. With the December numbers, we now have an initial look at annual trade data. The 2022 goods and services trade deficit was $948.1 billion, the highest on record. The goods and services deficit was 3.7% of current-dollar GDP in 2022, up from 3.6% in 2021. Exports had the largest one-year dollar increase ever at $453.1 billion in 2022 moving up to $3,009.7 billion total for the year. Imports totaled $3,957.8 billion in 2022. Both export and import totals for 2022 were the highest on record (Exhibit 4).
Exhibit 4. U.S. Annual Exports and Imports, 2018-2022
U.S. total nonfarm payroll employment increased by 517,000 in January, higher than the average monthly gain of 401,000 in 2022. Employment was widespread across sectors, though leisure and hospitality lead job gains followed by professional and business services. The unemployment rate was 3.4% for January. Both the labor force participation rate and employment-population ratio were unchanged after annual adjustments to population controls and have little net change since early 2022. The January Employment Situation report, released February 3 by the U.S. Bureau of Labor Statistics, contained revisions for establishment survey data based on annual benchmarking. Also, household survey data for January reflect updated population estimates.
Job openings rates increased in 10 states and decreased in 1 state in December and were little changed in 39 states based on the U.S. Bureau of Labor Statistics February 15 State Job Openings and Labor Turnover (JOLTS) release. For Arizona, the job openings rate ticked down to 6.4% from 6.5% in November. Over the month, the national job openings rate increased by 0.3 percentage points to 6.7%, surpassing the Arizona rate. The December hires rates increased in 4 states and were little changed in 46 states. Arizona’s figure for hires rates was unchanged at 4.2%. In December, total separations rates increased in 7 states, decreased in 6 states (including Arizona), and were little changed in 37 states. In Arizona, this number decreased by 0.6 percentage points for a December 2022 figure 4.1%. The national hires rate and total separations rate were unchanged over the month.
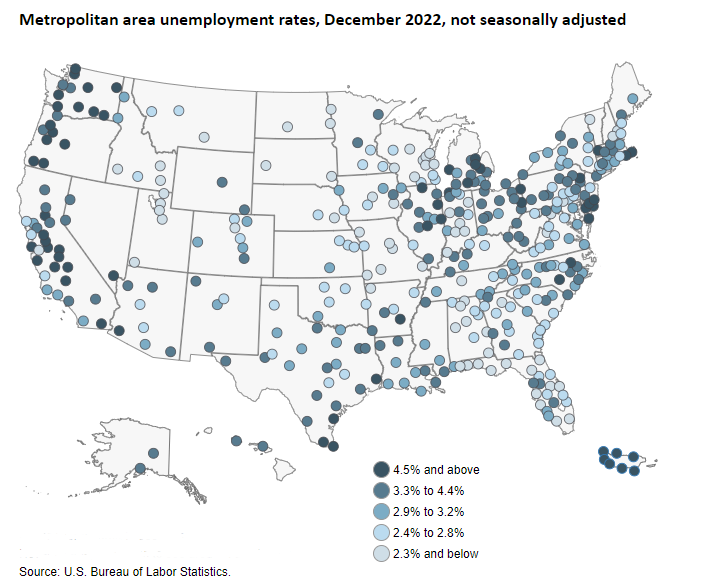
There were 172 metropolitan areas in the U.S. with unemployment rates lower than 3.0% in December 2022, two of which were in Arizona (Phoenix and Prescott). There were also two metropolitan areas with unemployment rates higher than 10.0%, one of which was in Arizona (Yuma). The lowest unemployment rate in the nation was Madison, WI with 1.6% while El Centro, CA had the highest at 14.8% based on the February 1 U.S. Bureau of Labor Statistics release for metropolitan area employment and unemployment. The U.S. unemployment for December was 3.3%. Arizona unemployment rates were 3.8% in Flagstaff, 3.9% in Lake Havasu City-Kingman, 2.7% in Phoenix, 2.7% in Prescott, 3.6% in Sierra Vista-Douglas, 3.1% in Tucson, and 13.7% in Yuma, as shown in Exhibit 5.
Exhibit 5. Metropolitan Area Unemployment Rates
Author: Valorie H. Rice is the Senior Business Information Specialist at the Economic and Business Research Center (EBRC) in the University of Arizona’s Eller College of Management. Student Researcher Shaw Zeider contributed to this report.