Across the top 30 markets CommercialEdge surveyed for its newest report, asking rents for industrial space averaged $6.31 per square foot in July and Phoenix led the nation with 24 million square feet of industrial space under construction.
The highest average rent increases were recorded in port markets, with Southern California in the lead. Specifically, leasing rates grew fastest in the Inland Empire (6.9%), followed by Los Angeles (6.4%), which slipped to second place in July. At the same time, rents for industrial space in New Jersey climbed to the third spot by yearly growth, up 6.3% compared to July 2020. The northeastern port city was also home to the highest premiums, $2.19 more per square foot, or 28.3% higher than the average rate.
READ ALSO: Amazon lifts Phoenix industrial market to best year ever in 2020
On the other hand, rents for Midwestern industrial markets remained relatively stable through July, especially in areas where high levels of industrial stock hit the market in recent years. In particular, industrial leasing rates in Kansas City grew 1.2% year-over-year, while asking rents in Indianapolis rose by 1.3% during the same period.
Meanwhile, the industrial sector vacancy rate in July averaged 5.8% across the top 30 markets. The lowest vacancy rate was in the Inland Empire, where the scarcity of developable land and rising construction costs are making their mark on supply. The industrial sectors in Columbus (2.2%) and Indianapolis (2.4%) were also tight in terms of availability. On the other hand, the Houston market recorded the highest vacancy rate among the top 30 industrial clusters (11.6%). At the same time, July vacancies averaged 9.3% in Boston and 8.4% in Tampa.
500MSF of Industrial Stock Under Construction, Nearly 24M in Phoenix
By the end of July, 500 million square feet of industrial space were under construction on a national level. An additional 458 million square feet were in the planning stages. These historically high numbers are associated with increased demand in the industrial real estate market. The e-commerce sector continues to grow, and The Infrastructure Investment and Jobs Act, if passed, is likely to further propel demand for data centers. The bill would increase the number of broadband users across the country, aiming to close the digital divide for the 23% of Americans who do not have broadband at home.
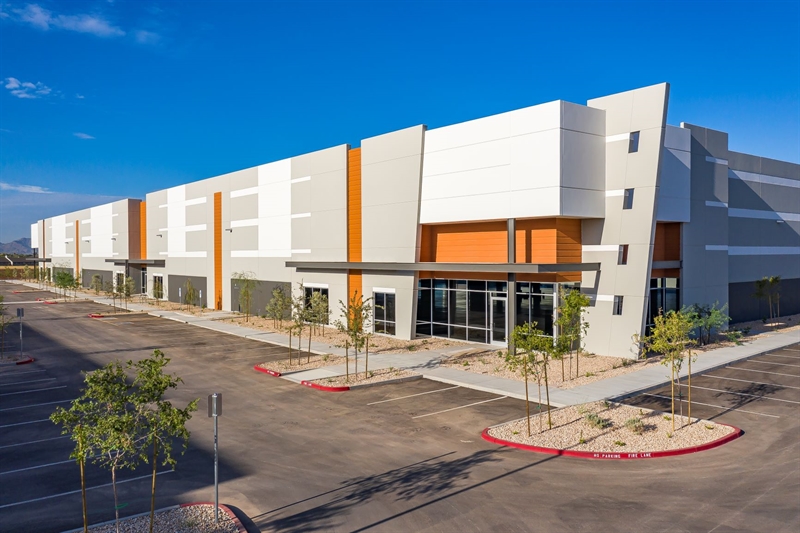
Unsurprisingly, the most robust industrial stock pipeline is in Phoenix, where construction is geared towards large projects such as data centers or spec development. Close to 24 million square feet of industrial space in the southwestern market were under construction in July, making up 9% of the total supply. At the same time, an additional 31 million square feet were in the planning stages, with under-construction and planned industrial stock accounting for 22.9% of the total industrial space in Phoenix.
Year-to-Date Sales Top $1B in Seattle and Bay Area, $2B in Los Angeles
Nearly $31 billion worth of industrial assets had changed hands by the end of July. The average price for sales completed through the first seven months of the year reached $108 per square foot, up 22.4% compared to 2020.
Seven markets recorded sales that topped $1 billion during the same period, with San Francisco and Seattle crossing the threshold this July. However, Los Angeles remains the market with the highest sales volume out of the top 30, surpassing $2 billion in the first seven months of the year.
Meanwhile, Orange County recorded the highest average sale price, $312 per square foot. The Southern California market also has the highest leasing rates and the least robust pipeline — under construction and planned stock make up just 1.5% of the total supply in the industrial sector.
Methodology
CommericalEdge added new markets to the National Industrial Report as Yardi Market Insight has increased its coverage to more than 50 markets in recent months. As such, the national numbers in this and future reports are not comparable to past issues.
The monthly CommercialEdge national industrial real estate report considers data recorded throughout the course of 12 months and tracks top U.S. industrial markets with a focus on average rents; vacancies (including subleases, but excluding owner-occupied properties); deals closed; pipeline yield; and forecasts, as well as the economic indicators most relevant to the performance of the industrial sector. For a detailed methodology, download the full report.


