According to Yardi Matrix research, the average sale price of an office building marked the first increase since 2021 last year — up 6.1% from $172 a year ago to $182 per square foot in 2025. Although most markets are still far below their 2019 values, many have begun to recover after significant increases in average prices last year.
Notably, values in four of the top 25 metros analyzed for this report have surpassed their respective pre-COVID 19 levels: Miami prices increased 20% from 2019, followed by Dallas (8.5%); Detroit (8.4%); and Orlando, Fla. (5.8%).
FOOD NEWS: 25 places for great patio dining in Arizona
THINGS TO DO: Want more news like this? Get our free newsletter here
Key highlights for the Western Markets
- Seattle retained the highest vacancy rate in the region, averaging 27% in January, followed by San Francisco with 24.7%.
- Asking rents for office space in San Francisco remained at the top of the regional list at the start of the year, with rates here averaging nearly $64 per square foot — almost double the national average of $32.55.
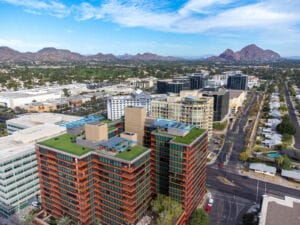
- In terms of YTD office sales in the region, the Bay Area retained its top spot, as transactions closed here in January amounted to nearly $360 million. The two other markets on the podium came at a considerable distance: San Diego with $174 million and Phoenix with $137 million.
- With the exception of Portland, Ore., ($53 per square foot), Denver ($57), and Phoenix ($230), all Western markets we analyzed averaged office sale prices above the national average of $278 per square foot.
- California markets led the region in terms of development last month: Los Angeles had a little more than 2 million square feet under construction, followed by San Diego with roughly 1.2 million square feet.
Vacancy Rates Remain High in Corporate Tech-Heavy Markets
The national average full-service equivalent listing rate for office space was $32.55 per square foot in January. At the same time, the national vacancy rate dipped 150 bps compared to the previous year to rest at 18.2% at the close of January.
Of the 25 largest markets that we analyzed, 15 saw decreases in their vacancy rates since last January. While the level of vacancy seems to have somewhat stabilized in certain markets, others continue to see fluctuation. Namely, vacancy dropped by more than 300 bps during the last 12 months in Manhattan, N.Y., and California’s Bay Area.
Specifically, New York City office vacancy decreased 350 bps to reach 13.1% at the close of January for the lowest vacancy rate among the top markets analyzed for this report. On the opposite coast, the Bay Area saw a 320-bps year-over-year drop in vacancy, averaging 23.1% last month.
That said, tech-heavy metros continue to experience stubbornly high rates. Such is the case for Seattle, which has the highest vacancy rate among the top 25 markets in the U.S. at 27%. Plus, Amazon’s recently confirmed plans to “remove bureaucracy” by shedding some 16,000 corporate jobs across its operations in the U.S., Canada, and Costa Rica further fuel speculation that the office vacancy rate in Seattle is likely to climb even higher.
2-Month Construction Starts Mark Notable Y-o-Y Increase
As of January, nearly 29 million square feet of office space was under construction in the U.S. markets we tracked for this report. This marks a nearly 43% Y-o-Y drop from the roughly 51 million square feet that was under construction at the start of last year. Plus, a full turnaround is unlikely for the shrinking office supply pipeline. Even so, it’s worth noting that there has been an uptick in construction starts.
According to Yardi Matrix data, the nearly 14 million square feet of office space started during the last year represents an 18.5% increase during the prior 12-month period. And, although starts remain at a historic low, this increase does mark a significant shift and encourages developer hopes that it might grow into a boost to new project construction.