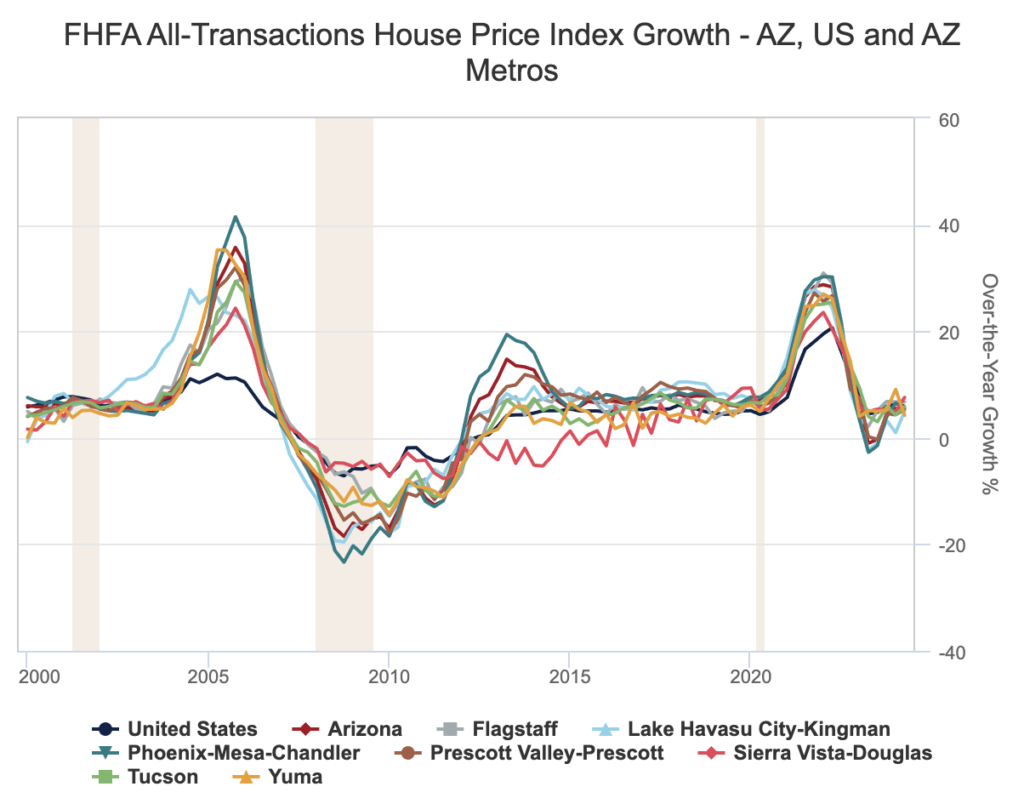
House prices increased 5.7% nationally over the year for the second quarter of 2024 based on the Federal Housing Finance Agency House Price Index. All 50 states and the District of Columbia had increased house prices between the second quarter of 2023 and the second quarter of 2024.
MORE NEWS: The 10 fastest-growing housing markets in Arizona
Areas of the country with the largest bump in house prices were the Middle Atlantic and New England states, with Vermont posting the biggest gain, at 13.4% over the year, followed by West Virginia, at 12.3%, Rhode Island, at 10.1%, and Delaware, at 10.0%. Prices in Arizona rose 5.1% over the year, tying with Washington at 34th among states. Idaho posted the smallest gain in prices at 1.1%. Metropolitan areas are available using the all-transactions index, including purchase and refinance mortgages (the state and national figures above represent purchase-only figures). The one-year change in prices for Arizona metro areas in the second quarter of 2024 was Flagstaff at 6.7%, Lake Havasu City-Kingman at 5.0%, Phoenix at 5.4%, Prescott Valley-Prescott at 5.4%, Sierra Vista-Douglas at 7.6%, Tucson at 5.9%, and Yuma at 4.2%. The U.S. and Arizona one-year price changes reflected in the all-transactions index for the second quarter were 5.9% and 5.5%, respectively. –Valorie Rice
Real GDP increased at an annual rate of 3.0% in the second quarter of 2024 according to a revised estimate from the U.S. Bureau of Economic Statistics released August 29. The initial estimate for the quarter had been 2.8% and was revised upward chiefly due to more consumer spending. Real GDP had risen 1.4% in the first quarter of 2024. Current-dollar GDP increased at an annual rate of 5.5% for the second quarter, an upward revision from the advance estimate of 5.2%. Real gross domestic income (GDI) rose 1.3% in the second quarter, matching what it had done in the first quarter. The next GDP release will be on September 26th and include revisions to the first quarter of 2019 based on the 2024 annual update of the National Economic Accounts. –Valorie Rice
Phoenix house prices rose 3.7% in June on an annual basis according to the S&P CoreLogic Case-Shiller Index August 27 release. Nationally, house prices reported a gain of 5.4% in June, down from 5.9% in May. New York, San Diego, and Las Vegas remained the top three cities in terms of annual price gains at 9.0%, 8.7%, and 8.5%, respectively, in June. With a year-over-year change of 0.8%, Portland again had the smallest increase in house prices of the 20 cities, a position it has been in for five of the last six months. The 20-city composite posted a gain of 6.5% for June. All 20 cities reported monthly price increases from May to June, ranging from 0.1% in Portland and San Francisco to 1.1% in Detroit. –Valorie Rice
The July 2024 release of the Job Openings and Labor Turnover (JOLTS) report stated that the number of job openings in the U.S. changed little to 7.7 million, down from a revised 7.9 million in June. The job opening rate was 4.6% for the month. The industry with the largest increase was professional and business services (+178,000). The sector with the largest decrease was health care and social assistance (-187,000). Nationally, the number of hires was 5.5 million, with a rate of 3.5% for July and 3.3% for June. The number of total separations in the nation increased to 5.4 million (+336,000), with a rate of 3.4%. The number of quits was unchanged at 3.3 million with a rate of 2.1%. The number of layoffs and discharges changed little at 1.8 million and a rate of 1.1%. –Alex Jaeger
In July, over the year unemployment rates were higher in 350 of the 389 metropolitan areas, lower in 22, and stable in the remaining 17. The July unemployment rate for the Tucson and Phoenix metropolitan areas came in at 4.3% and 3.9%, respectively. Yuma had the highest unemployment rate in Arizona at 16.0%, while Phoenix had the lowest. Sioux Falls, SD, had the lowest unemployment rate at 1.6%, followed by Rapid City, SD, at 1.8%, and Burlington-South Burlington, VT, at 1.9%. El Centro, CA, had the highest rate at 18.7%. The largest over-the-year increase occurred in Toledo, OH (+2.8 percentage points), and Gulfport-Biloxi-Pascagoula, MS, had the largest decrease (-0.6 percentage point). –Delaney O’Kray-Murphy
The U.S. unemployment rate changed little in August at 4.2%, while total nonfarm payroll employment increased by 142,000, according to the Bureau of Labor Statistics September 6th employment situation summary. The unemployment rates for major worker groups saw little or no change in August, with teenagers (14.1%) having the highest unemployment rate and adult women (3.7%) having the lowest. Total nonfarm payroll increased by 142,000 over-the-month in August, below the average monthly gain of 202,000 over the past 12 months. Employment trended up in construction (34,000), health care (31,000), and social assistance (+13,000). Manufacturing employment edged down in August (-24,000), while other major industries saw little change over the month. –Delaney O’Kray-Murphy
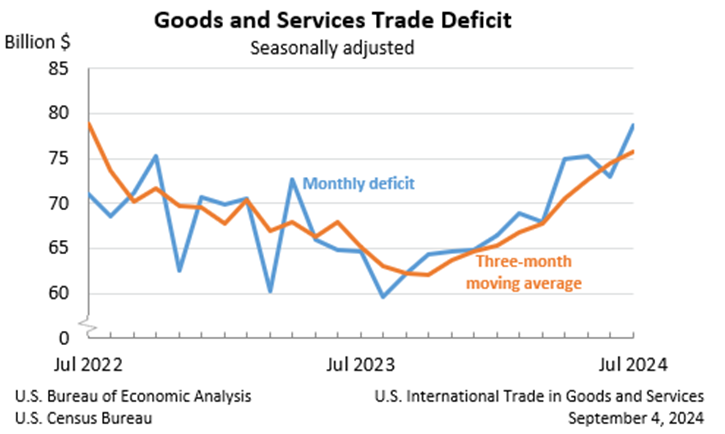
The July goods and services trade deficit came in at $78.8 billion, up $5.8 billion from a revised $73.0 billion in June. July exports rose $1.3 billion, and imports similarly rose $7.1 billion. The increase in the deficit reflects an increase in the goods deficit of $5.6 billion to $103.1 billion and a decrease in the services surplus of $0.2 billion to $24.3 billion. Over the year, the goods and services deficit increased by $36.2 billion, or 7.7%, with exports rising by 3.7% and imports by 4.5%. The largest surpluses, in billions, occurred with Netherlands ($4.7), South and Central America ($4.2), and Hong Kong ($1.8), while the greatest deficits were with China ($27.2), European Union ($18.4), and Mexico ($13.6). –Delaney O’Kray-Murphy