
Housing affordability increased nationally and in all Arizona metropolitan areas for the first quarter of 2023 based on the latest National Association of Home Builders/Wells Fargo Housing Opportunity Index (released June 8).
DEEPER DIVE: Here’s the salary needed to buy a home in Phoenix
Rising incomes and lower home prices contributed to improved affordability. New and existing homes sold nationally between January and March were affordable to 45.6% of families earning the U.S. median income. This was a larger share than in the fourth quarter of 2022 when only 38.1% of homes sold were affordable, but still far below the rate of 56.9% in the first quarter of 2022. Arizona metropolitan areas followed suit, as the share of affordable homes increased across the board at the beginning of 2023 yet fell short of the rates from a year ago. Tucson once again moved above the U.S. in the first quarter of 2023, with 46.8% of homes sold affordable to a family earning the median income, after having a smaller share of affordable homes than the nation for the last three quarters: Tucson historically has better housing affordability than the nation. The most sizable jumps in affordability were in the two areas of the state that are typically the most affordable – Sierra Vista-Douglas and Yuma – with more than 20 percentage points increase each from the last quarter of 2022 to the first quarter of 2023. The shares of homes sold affordable to families earning median income in Arizona metropolitan areas for the first quarter of 2023 were 64.6% in Sierra Vista-Douglas, 63.6% in Yuma, 46.8% in Tucson, 41.9% in Lake Havasu City-Kingman, 34.3% in Phoenix, 29.2% in Flagstaff, and 23.9% in Prescott Valley-Prescott. The least affordable housing markets were all in California.
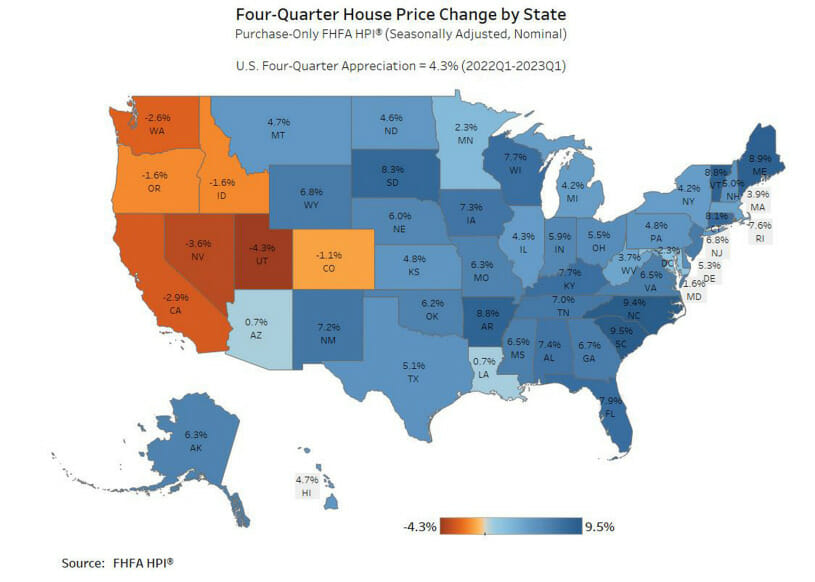
Arizona house prices barely increased between the first quarter of 2022 and the first quarter of 2023, moving up 0.7%, according to the Federal Housing Finance Agency (FHFA) House Price Index released May 30. Unlike Arizona, most western states had depreciation of house prices. South Carolina followed by North Carolina lead year-over-year house price increases in the first quarter of 2023. The South Atlantic region had the largest one-year change in house prices at 7.2%, the Mountain (-0.1%) and Pacific (-2.4%) regions had negative house price changes. Nationally, house prices gained 4.3% during the same period, seasonally adjusted. Data for the nation and states are for the purchase-only index. The House Price Index has information for all metropolitan areas for an all-transactions index that includes both purchase and refinance mortgages. The one-year changes in house prices for the Arizona metropolitan areas in the first quarter of 2023 were 4.3% in Flagstaff, 4.7% in Lake Havasu City-Kingman, 3.4% in Phoenix, 7.8% in Prescott Valley-Prescott, 5.3% in Sierra Vista-Douglas, 9.9% in Tucson, and 4.0% in Yuma.
Arizona’s non-seasonally adjusted total building permits experienced declines both month over month and year over year, according to the May 23 US Census Bureau Building Permits Survey. The total number of permits fell to 4,268, indicating a 34.6% decrease compared to the previous month and a 19.0% decrease compared to the same period last year. Among the different permit categories, two and three-to-four-unit permits showed slight increases over the month. However, permits for single family and five or more-unit buildings witnessed significant decreases. In Phoenix, a similar trend was observed, with an overall decline in permits primarily driven by a notable decrease in permits for single family and five or more-unit buildings. The growth in other areas was not sufficient to compensate for this decline. In Tucson, decreases were seen across all permit categories. The reported permit numbers for Phoenix and Tucson were 3,287 and 355, respectively. Notably, Phoenix managed to surpass its permit level from April 2022. Analyzing the different counties, Apache, Cochise, Maricopa, Mohave, Navajo, and Pinal experienced month over month decreases in permits. On the other hand, Coconino, Graham, Gila, Santa Cruz, Yavapai, and Yuma witnessed increases.
Housing prices
Phoenix housing prices were down 4.5% over the year in March. It was not alone, as half of the 20 cities contained in the S&P CoreLogic Case-Shiller Indices experienced negative house price changes over the year, most of them being in the West. Nationally, house prices gained 0.7% in March compared to 2.1% in February. The 20-city composite had a loss of 1.1% over the year according to the May 30 release. Despite decreases overall, cities in the Southeast exhibited strong price gains. Miami had the largest increase in house prices for an eighth month in a row, posting a 7.7% year-over-year increase for March followed by Tampa at 4.8% and Charlotte at 4.7%. Seattle and San Francisco had double-digit decreases in house prices at -12.4% and -11.2%, respectively.
The April 2023 release of the Job Openings and Labor Turnover survey stated that job openings in the U.S. increased slightly to 10.1 million, with a job openings rate of 6.1%. Industries that saw the largest increase in job openings were retail trade; health care and social assistance; and transportation, warehousing, and utilities. Nationally, the number of hires remained relatively stable at 6.1 million, with a rate of 3.9%. Total separations in the nation decreased to 5.7 million, with a separation rate of 3.7%. The number and rate of quits remained unchanged, coming in at 3.8 million and 2.4 percent, respectively. On the other hand, the number of layoffs and discharges decreased to 1.6 million while the rate decreased to 1.0%. Other separations in the U.S. were little changed, reporting at 333,000.
Authors: Story by Delaney O’Kray-Murphy, EBRC research economist; Valorie Rice, senior business information specialist; and Prarthana Magon, EBRC student researcher.