
The Federal Reserve has dramatically tightened monetary policy since this spring in order to fight the highest inflation rate in 40 years. Along with sharply raising the shortest-term rates on the yield curve, the Federal Funds Rate, the Fed stopped buying, and began unwinding their positions in, 30-year Treasury bonds and mortgage backed securities. Those policy moves have raised borrowing costs across the yield curve, and helped drive mortgage rates and the housing inflation rate dramatically higher. A homebuyer using a typical 30-year fixed-rate mortgage would pay an extra 50% in monthly loan payments now than in October 2021, for the same loan amount.
READ ALSO: Arizona No. 2 for largest house price appreciation
The Fed’s mission to reduce inflation has focused even more attention than usual on the contributions of different spending categories to inflation measures – and in particular on the cost of shelter, which makes up nearly one third of the Consumer Price Index (CPI) basket and just over 15% of the Personal Consumption Expenditure (PCE) index.
An early warning system
In February 2022, researchers at the San Francisco Fed published an Economic Letter showing how movements in the Zillow Observed Rent Index (ZORI) and Zillow Home Value Index (ZHVI) tend to predict movements in the major rent components of inflation as measured by CPI and PCE. In particular, ZORI proved to be a good predictor of actual inflation in both indexes, while ZHVI can help predict movement in owners’ equivalent rent (OER), which carries even more weight in inflation due to homeowners far outnumbering renters.
Using data available at the time, through December 2021, the authors predicted “that CPI rent inflation will increase by about 3.4pp for both 2022 and 2023, relative to its historical average rate of 3.7%. The model predicts a similar path for future OER inflation, but this prediction is less precise. … Applied to CPI inflation, our results imply an additional increase of 1.1pp for both 2022 and 2023. Applied to PCE inflation, which is the measure used by the Federal Reserve to gauge its 2% inflation target, our results imply an additional increase of 0.5pp for both 2022 and 2023.” In other words, the rent inflation measured by rising asking rents and prices in 2021 alone could already effectively bake in over a full percentage point of extra CPI inflation for both of the following years.
What goes up must slow down
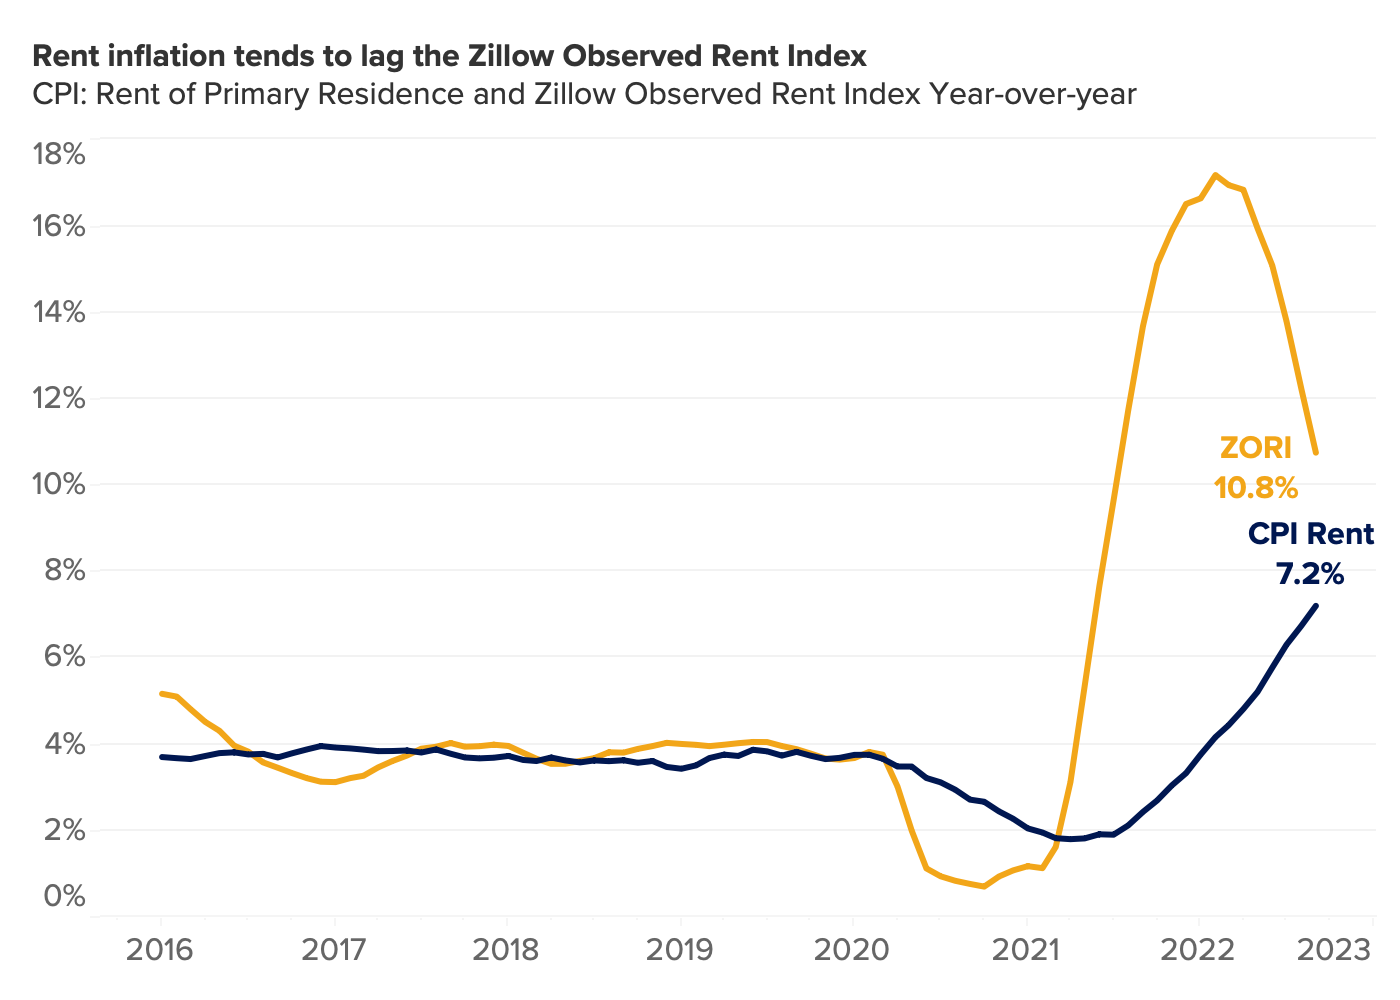
By coincidence, after the publication of the SF Fed’s research note in February 2022, it became clear that year-over-year growth in ZORI had peaked that same month, and it has rapidly declined since then, from 17.2% in February to 10.8% in September. That raises the natural question of when the CPI and PCE rent components might reach their own turning points and deceleration in year-over-year growth.
The SF Fed researchers find the strongest correlation between CPI rent and ZORI at a 12-month lag, so February 2023 is a natural candidate for the most likely turning point in CPI rent inflation. Given that monthly growth in the CPI rent component is running at an 11% annualized pace as of this writing (in September 2022 data), and it never exceeded a 6% annualized rate in 2021, monthly growth would need to drop sharply in order to sink below last autumn’s rate – a necessary condition for annual rent inflation to begin its decline. So it appears likely that a turning point in CPI rent inflation remains at least a few months in the future.
Why do the official indexes measuring housing inflation always lag behind ZORI?
There are two main reasons that official indexes such as CPI’s rent components will always tend to lag real-time asking rent indexes like ZORI:
1. New leases vs. all leases: By design, inflation measures seek to track average expenditures across all tenants, not just those signing new leases on publicly listed market-rate homes.
2. Sampling delay. Renters surveyed by the Bureau of Labor Statistics are only asked about their rent once every 6 months to avoid burdening them with a monthly survey response, given that rent tends to change only infrequently.
Researchers at the Bureau of Labor Statistics and the Cleveland Fed have just released a timely working paper that disentangles the reasons for differences in both timing and magnitude of rent inflation as measured by the CPI and private sector measures of asking rents, such as ZORI. They use the same rent survey microdata used to create the CPI, to construct a new-tenant repeat rent (NTRR) index, and an all-tenant repeat rent (ATRR) index. By using the same data and repeat-rent methods, these two measures can reveal that sampling delay is responsible for about a 3-month lag all on its own. In the authors’ words, “This one-quarter differential is the average time between BLS collection and actual rent change.”
The NTRR index, which focuses on newly signed leases, much like ZORI focuses on asking rents for new leases, and is highly correlated with ZORI, proving that the new-tenant vs. all-tenant distinction is the main driver of divergence between ZORI and official inflation measures of rent. The authors find that “NTRR leads ATRR by about three quarters, while it leads the CPI for rent by about four quarters,” adding to the body of evidence that we should expect a 12-month lag from ZORI’s high-water mark to annual CPI rent growth turning the corner.
Fed watchers should mark their calendars for February 2023 to see how this prediction holds up. If CPI rent inflation peaks that month, a deceleration would first be visible in the March 2023 data, to be released in mid-April.