In September, Arizona over-the-year building permits saw a significant 44.1% increase to a total of 5,793, not seasonally adjusted, according to research by the Eller Business Research Center. The number of single-family permits similarly saw a prominent rise over the year, increasing 43.5% to 3,135. The Phoenix metropolitan area accounted for a majority of the permits in the state with 4,758 issued, a 48.5% increase from last September. The number of single-family units additionally rose 51.8% to 2,254. The Tucson MSA showed similar growth, observing a 47.8% rise in the total units to 445 and a 70.0% increase in single-family units to 372. Of the counties, Cochise, Coconino, Gila, Mohave, Pinal, Santa Cruz, and Yuma all saw increases, while Apache, Graham, Navajo, and Yavapai all saw decreases. No change occurred in La Paz.
LEARN MORE: Where in Metro Phoenix are home prices rising? Here’s a look
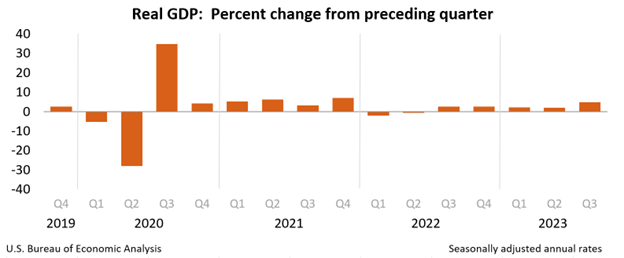
Real gross domestic product (GDP) increased at an annual rate of 4.9% in the third quarter of 2023, according to the advanced estimate released by the Bureau of Economic Analysis. The increase in real GDP reflects an increase in consumer spending, private inventory investments, exports, state and local government spending, and residential fixed investment which was somewhat offset by a decrease in nonresidential fixed investment and an increase in imports. The increase in consumer spending reflects increases in services such as housing and utilities; financial care and insurance; and food services and accommodations, and goods, led by prescription drugs and recreational goods and vehicles. Current-dollar personal income, disposable personal income, and personal savings all increased in the third quarter, albeit at a lower rate than in the second quarter.
In September, the U.S. Consumer Price Index for All Urban Consumers (CPI-U) increased by 0.4% on a seasonally adjusted basis, following a 0.6% rise in August. Over the past year, the all-items index increased by 3.7%. The main contributor to this monthly increase was the shelter index, responsible for over half of the overall rise, with an uptick in the gasoline index also playing a significant role. The energy index increased by 1.5% for the month. The food index rose by 0.2%, with food at home increasing by 0.1% and food away from home climbing by 0.4%. Excluding food and energy, the all-items index increased by 0.3% in September, mirroring the previous month’s rise. Notable increases included rent, owners’ equivalent rent, lodging away from home, motor vehicle insurance, recreation, personal care, and new vehicles, while indexes for used cars and trucks and apparel decreased. Over the last 12 months, the all-items index saw a 3.7% increase, matching August’s figures, and the all-items less food and energy index rose by 4.1%. Energy decreased by 0.5% over the year, while the food index increased by 3.7%.
The U.S. Producer Price Index for final demand increased by 0.5% in September, following 0.7% and 0.6% gains in August and July, respectively. Over the year ending in September, the index rose by 2.2%, marking its highest increase since April’s 2.3% jump. The primary driver of this growth was a 0.9% increase in prices for final-demand goods, with final-demand services rising by 0.3%. Excluding food, energy, and trade services, the final demand index increased by 0.2% in September, and it rose by 2.8% over the past 12 months. Goods prices were driven by a 3.3% surge in energy prices, while services saw a prominent 13.9% increase in deposit services. On the other hand, prices for airline passenger services declined by 2.1%. Notable changes also included increases in machinery, equipment, and retail services, while prices for automobile retailing and telecommunications access services decreased.
Total nonfarm employment in Arizona increased by 67,300 jobs over-the-year in September, with the seasonally- adjusted unemployment rate growing to 4.0% from 3.8% in August. The U.S. seasonally- adjusted unemployment rate remained steady over the month at 3.8%. Arizona non-seasonally adjusted total nonfarm employment increased by 30,900 jobs in September, beating the pre-pandemic average of 28,800. Employment gains were reported in Government (16,300), Private Education and Health Services (9,400), Professional and Business Services (2,400), Trade, Transportation, and Utilities (2,300), Leisure and Hospitality (2,000), Manufacturing (1,000), Other Services (500), and Financial Activities (400). Employment losses occurred in Information (-2,000) and Construction (-1,300).
According to the October 18th State Job Openings and Labor Turnover (JOLTS) report, job openings rates increased in August for 13 states, decreased in two states, and were little changed in all other states. The job openings rates for Arizona were 6.0% for August, 5.9% for July, and 5.5% for June. The number of job openings increased in 23 states, decreased in 2 states, and was little changed in the remaining 25 states. Arizona changed little with +2,000. Additionally, Arizona was one of the 40 states with little change to the number of layoffs and discharges with -10,000. Eight states saw increases, and four saw decreases. Nationally, the hire rates and the number of hires were little changed.
Authors: This story was written by Delaney O’Kray-Murphy, EBRC research economist; Alexandra Jaeger, EBRC web applications developer; and Prarthana Magon, EBRC student researcher.