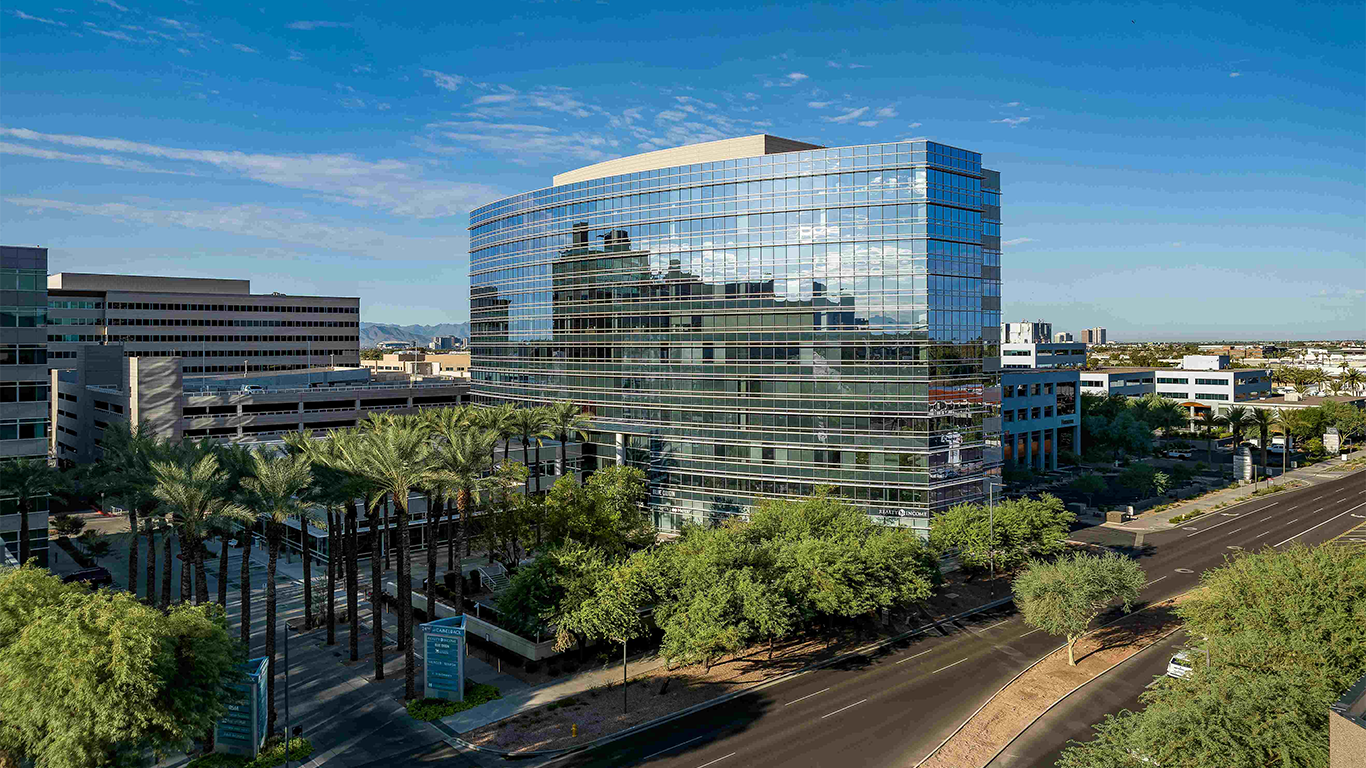
Most Western U.S. markets had vacancy rates above the national average of 18.7% in August, according to this month’s Office Report from CommercialCafe. For instance, last month, Seattle saw the highest vacancy rate in the region with a little more than 27% of space unoccupied, while San Francisco was second in the region with vacancy here reaching nearly 26% in August. Meanwhile, Phoenix remains one of the only large markets where office asking rates fall below the national average.
Key highlights:
- The northern California market topped the regional list for listing rates, with office space in San Francisco asking a little more than $64 per square foot in August — nearly double the national average of $32.63.
- Denver; Phoenix; and Portland, Ore., remained the only large markets in the region where office asking rates rested below the national average in August, each at around $29 per square foot.
- The top position in the region in terms of office sales was taken by the Bay Area, where YTD transactions totaled more than $3.4 billion.
- The Bay Area also stood out when looking at sale prices: Office space here commanded the highest average sale price per square foot so far this year ($378).
- California markets were also in the lead for development last month: Los Angeles (2.1 million square feet under construction), San Diego (1.8 million square feet), and San Francisco(1.5 million square feet) were the only markets in this group with more than 1 million square feet of new office space in development as of the start of September.
Other key Takeaways:
- The national office vacancy rate was close to 18.7% in August, following a modest decrease of 80 basis points year-over-year.
- The national office listing rate averaged $32.63 per square foot in August, which marked a 0.4% slip from the previous year.
- The office supply pipeline remained modest at the start of September with a little more than 40 million square feet of office space currently under construction.
- Manhattan, N.Y., topped the list for YTD sales through August in terms of dollar volume (nearly $5 billion), followed by the Bay Area ($3.4 billion) and Washington, D.C. ($3.1 billion)
- Seattle; Austin, Texas; and San Francisco had the highest vacancy rates in August, each above 25%.
- Office asking rates in Manhattan, N.Y., and San Francisco were roughly double the national average, while Midwestern markets remained among the most affordable.
- The Boston office pipeline was the most active with nearly 5.6 million square feet of new office space under construction.
LOCAL NEWS: 10 things you may not know are manufactured in Arizona
INDUSTRY INSIGHTS: Want more news like this? Get our free newsletter here
Office Sector Continues Reckoning with Low Occupancy
According to a recent Flex Index report, two-thirds of U.S. firms continue to offer attendance flexibility, largely in some form of hybrid work. As these options seem to have become an expectation in much of the corporate world, many offices are occupied far below capacity, more than five years since the start of COVID.
But, while office utilization might not return to pre-pandemic levels, that does not bode the same across the entirety of the U.S. office sector. For instance, New York City is seeing the most leasing activity and highest demand of the last five years, while vacancy rates remain near record highs in most other large markets. High-quality properties offering a wealth of valued amenities in desirable locations continue to have an easier time stimulating higher occupancy.
“As physical occupancy rates remain stubbornly low in the 50-55% range, the uptick in activity and leasing demand that New York City has seen recently has failed to gain a foothold across most of the country,” said Peter Kolaczynski, Director, Yardi Research.
Flight-to-Quality Continues to Drive Leasing to Class A Stock
The national average full-service equivalent listing rate for office space was $32.63 per square foot in August, which followed a slight correction of -0.4% year-over-year (Y-o-Y). Meanwhile, the national vacancy rate dipped 80 basis points (bps) compared to the previous year to reach 18.7% last month.
For instance, in markets like Seattle; Austin, Texas; and San Francisco, where the supply pipeline could barely keep up with demand during the previous decade, we’re now seeing vacancy rates well above 20%. While tempting to chock it all up to remote and hybrid work, several transformational shifts ended up affecting the absorption of new stock in recent years.
First, construction in the late 2010s was booming to stay ahead of the needs of a rapidly expanding tech sector. Then, after 2020, a relatively abrupt shift in tech sector priorities resulted in mass layoffs and investments being more concentrated in data centers for generative AI development than in hiring workers.
Because few office markets are seeing new development and highly amenitized properties continue to do well with flight-to-quality tenants, the office sector will likely continue to reform toward keeping up with what tenants value most in order to draw higher occupancy overall.


