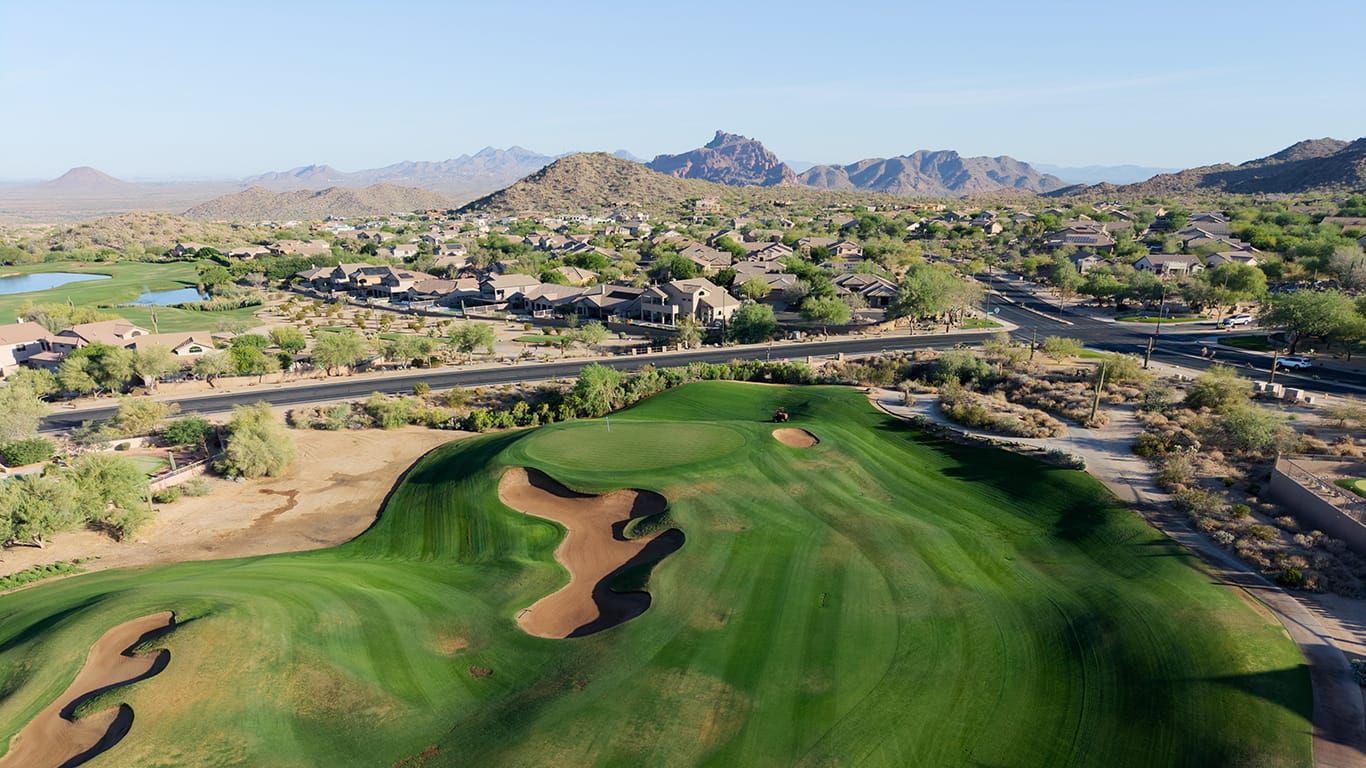
Arizona’s housing market continued shifting toward buyers in August, with home prices declining in both metro Phoenix and Tucson as higher mortgage rates and seasonal slowing cooled demand across the country.
The Phoenix-Mesa-Chandler metro posted a median listing price of $475,000 in August, down 4.8% from a year earlier, according to the Realtor.com August 2026 Monthly Housing Trends Report. The decline was considerably steeper than the national decrease of 1.3%.
At the same time, Greater Phoenix buyers had more homes to choose from. Active listings increased 5.2% year over year, while new listings edged up 0.6%. The median price per square foot declined 1.4%.
Perhaps most encouraging for buyers, homes in metro Phoenix were moving faster than they did a year ago despite lower asking prices. Median time on market improved by three days year over year. And although 27.6% of Phoenix-area listings had undergone a price reduction, that share was 0.8 percentage points lower than a year earlier.
LATEST NEWS: 20 best U.S. cities for retirement includes 2 from Arizona
LEARN MORE: Arizona earns 19 Michelin Guide selections in inaugural Southwest Guide
Tucson housing market shows different dynamics
Tucson also experienced price pressure, but its inventory picture looked notably different.
The Tucson metro’s median listing price stood at $374,900 in August, down 2.6% year over year, while median price per square foot fell 2.5%. Active inventory decreased slightly, falling 0.6% from August 2025.
New listings, however, jumped 9.8% year over year, potentially giving Southern Arizona buyers additional options heading into fall. Homes also spent one fewer day on the market than a year earlier. About 20.6% of listings had price reductions, down 1.9 percentage points from August 2025.
Arizona follows a cooling Western market
The Arizona numbers fit into a broader slowdown across the West. The region’s median listing price reached $599,000 in August, declining 2.1% annually. Active inventory increased 3.2%, new listings rose 1.5% and 22% of listings had price reductions.
Nationally, the median listing price dropped to $424,500, down 1.3% year over year and 1% from July. It marked the 10th consecutive month of annual declines in list prices.
Meanwhile, 20.4% of active listings nationally had a price reduction, and inventory climbed 3.6% year over year to approximately 1.14 million homes. Despite the increase, national inventory remained 11.1% below typical pre-pandemic levels.
The market is also showing signs of softer buyer demand. Pending listings declined 0.2% year over year, snapping an eight-month streak of annual gains, while contract signings fell 3.7%.
“August’s data shows a housing market entering its seasonal cool-down with less momentum than it had earlier this year,” said Danielle Hale, chief economist at Realtor.com. She noted that higher mortgage rates combined with the normal late-summer slowdown are making buyers increasingly selective.
For Arizona, the August numbers point to a market increasingly defined by price sensitivity and buyer choice. Greater Phoenix sellers face considerably lower asking prices than a year ago alongside expanding inventory, while Tucson is experiencing a surge in new listings despite a slight decline in overall inventory.
As the fall housing season begins, the question will be whether Arizona’s price declines create enough affordability relief to bring more buyers back into the market — or whether elevated borrowing costs continue keeping many on the sidelines.
August 2026 Top 50 Metros Housing Overview
| Metro | Active Listing Count YoY | New Listing Count, YoY | Median List Price | Median List Price, YoY | Median List Price Per SF, YoY | Median Days on Market, YoY (Days) | Price- Reduced Share | Price- Reduced Share, YoY (Percentage Points) |
| Atlanta-Sandy Springs-Roswell, GA | 3.4 % | -3.4 % | $419,900 | 1.2 % | -0.3 % | 2 | 25.0 % | -0.2 |
| Austin-Round Rock-San Marcos, TX | 0.3 % | 1.2 % | $450,000 | -9.8 % | -8.1 % | 1 | 27.6 % | -1.1 |
| Baltimore-Columbia-Towson, MD | 19.2 % | 0.7 % | $375,000 | -5.5 % | -3.2 % | 5 | 20.4 % | 1.2 |
| Birmingham, AL | 9.9 % | 3.0 % | $299,850 | 0.0 % | -0.4 % | 1 | 18.8 % | 0.8 |
| Boston-Cambridge-Newton, MA-NH | 15.0 % | -0.1 % | $795,000 | -0.6 % | -1.5 % | 6 | 14.8 % | -3.0 |
| Buffalo-Cheektowaga, NY | 29.8 % | 4.8 % | $273,700 | -4.0 % | -2.3 % | 3 | 11.1 % | 1.5 |
| Charlotte-Concord-Gastonia, NC-SC | 15.5 % | 0.3 % | $429,000 | -2.5 % | -1.1 % | 4 | 26.0 % | 1.2 |
| Chicago-Naperville-Elgin, IL-IN | -6.0 % | -7.5 % | $395,000 | 5.4 % | 3.6 % | -1 | 14.6 % | -1.8 |
| Cincinnati, OH-KY-IN | 17.1 % | -1.2 % | $349,900 | 1.1 % | -0.7 % | 5 | 21.3 % | 2.4 |
| Cleveland, OH | 13.6 % | 6.0 % | $260,000 | -1.8 % | 1.6 % | 0 | 20.2 % | 2.7 |
| Columbus, OH | 10.9 % | -1.8 % | $379,900 | -0.1 % | -0.5 % | 3 | 28.2 % | 1.3 |
| Dallas-Fort Worth-Arlington, TX | -4.4 % | -2.5 % | $425,000 | -1.2 % | -2.0 % | 0 | 27.5 % | -0.8 |
| Denver-Aurora-Centennial, CO | 2.1 % | 6.4 % | $574,900 | -4.2 % | -3.4 % | -1 | 31.4 % | 0.0 |
| Detroit-Warren-Dearborn, MI | 13.6 % | 0.8 % | $275,000 | -1.4 % | 1.7 % | 2 | 19.4 % | 1.5 |
| Hartford-West Hartford-East Hartford, CT | 1.7 % | 2.2 % | $459,950 | 2.4 % | 3.2 % | -2 | 10.1 % | 0.3 |
| Houston-Pasadena-The Woodlands, TX | 2.2 % | -2.6 % | $359,000 | -1.6 % | -2.2 % | 1 | 21.3 % | -0.7 |
| Indianapolis-Carmel-Greenwood, IN | 20.8 % | 3.5 % | $310,000 | -5.3 % | 4.4 % | 4 | 28.8 % | -0.6 |
| Jacksonville, FL | -16.9 % | 5.5 % | $380,000 | -4.8 % | -2.2 % | -9 | 24.3 % | -5.6 |
| Kansas City, MO-KS | -0.4 % | -4.4 % | $390,000 | -0.5 % | 1.3 % | 0 | 18.8 % | 1.4 |
| Las Vegas-Henderson-North Las Vegas, NV | 6.9 % | -2.1 % | $469,000 | -0.9 % | -2.2 % | 2 | 24.2 % | 0.0 |
| Los Angeles-Long Beach-Anaheim, CA | -0.3 % | -2.6 % | $1,050,000 | -4.5 % | -2.1 % | 0 | 16.6 % | -0.2 |
| Louisville/Jefferson County, KY-IN | 25.4 % | -0.2 % | $315,000 | -1.6 % | 0.7 % | 5 | 23.3 % | 1.8 |
| Memphis, TN-MS-AR | 9.8 % | -5.4 % | $299,990 | -9.9 % | -4.1 % | 4 | 25.3 % | 1.4 |
| Miami-Fort Lauderdale-West Palm Beach, FL | -15.0 % | -1.0 % | $490,000 | -2.0 % | -0.8 % | -5 | 14.6 % | -2.8 |
| Milwaukee-Waukesha, WI | 10.7 % | 2.8 % | $399,900 | 0.0 % | 2.6 % | 4 | 15.6 % | 0.4 |
| Minneapolis-St. Paul-Bloomington, MN-WI | 32.9 % | 13.3 % | $419,900 | -3.1 % | -2.1 % | 0 | 20.3 % | 3.3 |
| Nashville-Davidson–Murfreesboro–Franklin, TN | 12.6 % | 0.6 % | $539,900 | 0.0 % | -0.8 % | 1 | 22.0 % | 0.8 |
| New York-Newark-Jersey City, NY-NJ | 3.2 % | -1.7 % | $749,000 | -1.4 % | -0.5 % | -2 | 10.2 % | 2.3 |
| Oklahoma City, OK | 7.8 % | -10.1 % | $314,000 | -1.9 % | 0.1 % | 5 | 23.8 % | 0.9 |
| Orlando-Kissimmee-Sanford, FL | -2.5 % | 5.4 % | $415,000 | -1.9 % | -2.6 % | -2 | 23.3 % | -0.3 |
| Philadelphia-Camden-Wilmington, PA-NJ-DE-MD | 13.3 % | 1.4 % | $374,900 | -1.3 % | -0.6 % | 4 | 16.7 % | 1.2 |
| Phoenix-Mesa-Chandler, AZ | 5.2 % | 0.6 % | $475,000 | -4.8 % | -1.4 % | -3 | 27.6 % | -0.8 |
| Pittsburgh, PA | 15.0 % | 0.8 % | $249,900 | -1.6 % | 0.1 % | 3 | 20.8 % | 0.6 |
| Portland-Vancouver-Hillsboro, OR-WA | 2.8 % | -1.7 % | $595,000 | -0.7 % | -2.4 % | 1 | 30.5 % | -0.3 |
| Providence-Warwick, RI-MA | 16.1 % | 4.9 % | $589,000 | -1.7 % | 9.3 % | 1 | 12.1 % | 0.3 |
| Raleigh-Cary, NC | 6.2 % | -2.1 % | $450,000 | -1.1 % | -2.3 % | 4 | 24.1 % | -0.8 |
| Richmond, VA | 20.9 % | 9.3 % | $440,000 | 2.4 % | 1.5 % | -2 | 17.0 % | -0.2 |
| Riverside-San Bernardino-Ontario, CA | -4.4 % | 1.5 % | $589,900 | -1.5 % | -1.4 % | -3 | 18.4 % | -0.2 |
| Sacramento-Roseville-Folsom, CA | -4.3 % | 3.8 % | $615,000 | -0.8 % | -0.7 % | -1 | 22.3 % | -0.5 |
| St. Louis, MO-IL | 16.6 % | -0.8 % | $289,900 | -3.4 % | -1.2 % | 0 | 19.7 % | 2.6 |
| Salt Lake City-Murray, UT | 10.9 % | 8.4 % | $567,000 | -2.7 % | 0.6 % | -1 | 30.3 % | -0.6 |
| San Antonio-New Braunfels, TX | 3.8 % | 0.0 % | $324,000 | -1.8 % | -3.6 % | 0 | 28.0 % | 1.2 |
| San Diego-Chula Vista-Carlsbad, CA | -4.9 % | 5.5 % | $899,000 | -5.4 % | -2.9 % | 0 | 20.0 % | -1.5 |
| San Francisco-Oakland-Fremont, CA | -13.0 % | 0.0 % | $911,375 | -5.0 % | -3.8 % | -7 | 13.9 % | -0.9 |
| San Jose-Sunnyvale-Santa Clara, CA | 9.0 % | 16.6 % | $1,349,000 | -2.1 % | -1.3 % | -4 | 14.6 % | 0.1 |
| Seattle-Tacoma-Bellevue, WA | 27.3 % | 10.2 % | $750,000 | -3.2 % | -1.8 % | 1 | 23.1 % | 3.1 |
| Tampa-St. Petersburg-Clearwater, FL | -6.4 % | -1.4 % | $390,000 | -6.0 % | -5.6 % | -3 | 25.5 % | -2.0 |
| Tucson, AZ | -0.6 % | 9.8 % | $374,900 | -2.6 % | -2.5 % | -1 | 20.6 % | -1.9 |
| Virginia Beach-Chesapeake-Norfolk, VA-NC | 12.2 % | 12.9 % | $434,000 | 5.1 % | 2.9 % | -1 | 22.6 % | -0.2 |
| Washington-Arlington-Alexandria, DC-VA-MD-WV | 13.8 % | 2.5 % | $565,000 | -5.8 % | -2.1 % | 4 | 19.0 % | 1.5 |