According to a new report from RealPage, the leading provider of software and data analytics to the real estate industry, effective asking rents in Phoenix grew 3.4 percent in July, the second largest monthly hike in the nation. That big Phoenix apartment rent monthly increase took rents up 21.6 percent year-over-year, the largest annual apartment rent increase among the nation’s 50 largest apartment markets.
READ ALSO: 5 Arizona housing market predictions for 2021
Some additional highlights specific to Phoenix apartment rent include:
• By comparison, U.S. rents jumped 2.2 percent in July and were up 8.3 percent year-over-year. Annual rent growth hit an all-new record high, surpassing the last record set in 2000 and 2001 during the dot-com boom.
• Average effective asking rents are at $1,483 per month in Phoenix, still about $66 below the U.S. average.
• Phoenix apartment occupancy climbed 1.6 percentage points in the last year, to 97.3 percent in July. The national average for apartment occupancy stands at 96.9 percent, an all-time high.
The performance momentum seen in the nation’s apartment market continued in July, when both rent growth and occupancy reached new all-time highs.
Effective asking rents jumped 2.2% just in the month of July, driving prices up 8.3% year-over-year. That annual rent growth shot past the previous record set in the 2000-2001 time period.
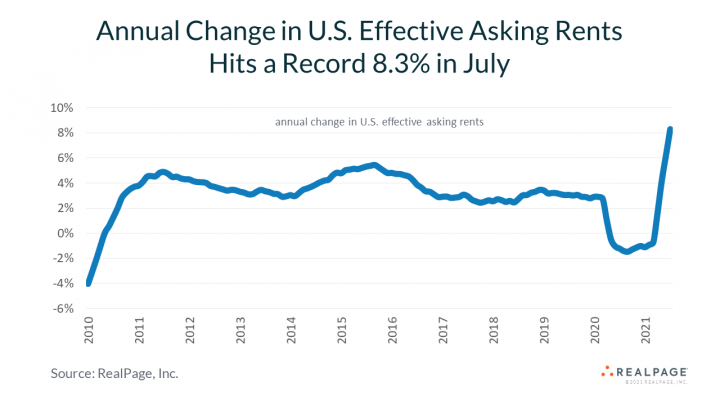
The country’s average monthly rent has reached $1,549.
Pushing rents upward, occupancy is also now at a new all-time record level. Today’s rate is at 96.9%, again surpassing the earlier highs established in 2000-2001.
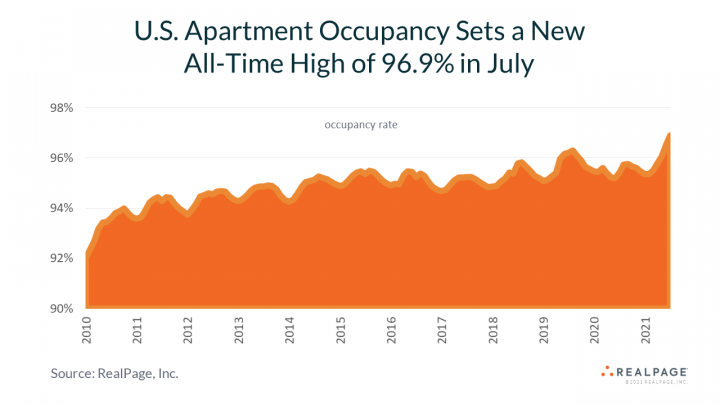
Momentum in the country’s apartment market performance metrics likely is peaking right now. Leasing activity normally begins to slow in the last half of the 3rd quarter. In turn, apartment property owners and operators tend to get a little less aggressive when pricing units. In similar timing, occupancy usually peaks in July or August and then backs up slightly as the year moves toward its conclusion.
Big Rent Growth Remains Widespread
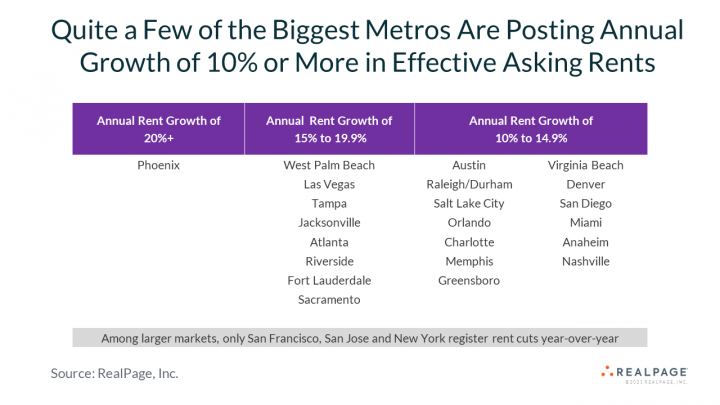
Annual growth in effective asking rents comes in at more than 10% in 65 of the country’s 150 largest metros, including 22 spots where year-over-year price increases are at 15% or more.
Relatively small Boise, ID posts the most aggressive annual rent growth in that 150-metro group of markets, with pricing up 24.2%.
Looking specifically at bigger places with at least 100,000 apartment units, Phoenix registers 21.6% annual rent growth, and there are price hikes of roughly 19% across West Palm Beach, Las Vegas and Tampa.
Annual rent growth is at 15% to 17% across Jacksonville, Atlanta, Riverside/San Bernardino, Fort Lauderdale and Sacramento.
Another 13 big metros register annual price increases of 10% or more, including Austin, Denver and Southeast demand hot spots like Raleigh/Durham, Orlando, Charlotte, Miami and Nashville.
Most of the country’s key gateway metros that recorded rent cuts in 2020 now post moderate annual rent growth. Effective asking rents are up 4% to 5% year-over-year in Chicago, Boston and Los Angeles. Annual price increases around 2% to 3% are seen in Seattle, the Washington, DC area, Newark/Jersey City and Oakland.
However, yearly price moves still aren’t yet back in positive territory in San Francisco (-5.9%), San Jose (-2.1%) and New York (-1.6%).
The only other spot across the country suffering rent loss is the West Texas Oil Patch, where annual rent change is at -5.3% in Midland/Odessa.
Small Metros Are Occupancy Leaders
Small markets dominate the list of the country’s apartment occupancy leaders, in part because there’s so little construction activity in these locations.
Occupancy reaches 99% or better in a trio of small-metro locations: Salisbury, MD in the Eastern Shore cluster of small towns with fishing, farming and tourism-focused economies, as well as Allentown, PA and Eugene, OR.
Among big metros, occupancy leaders are Providence, Riverside/San Bernardino, San Diego, Virginia Beach and Anaheim. All have occupancy rates that reach 98% or better as of July.
Only a handful of spots register less-than-full occupancy rates.
Midland/Odessa continues to struggle notably, with occupancy at only 89.2%. The next lowest occupancy figure is the 92.7% in College Station/Bryan, TX.
Houston, San Francisco and San Antonio are the big metro occupancy laggards, but even in those locations the performance really isn’t bad at roughly 95%.


