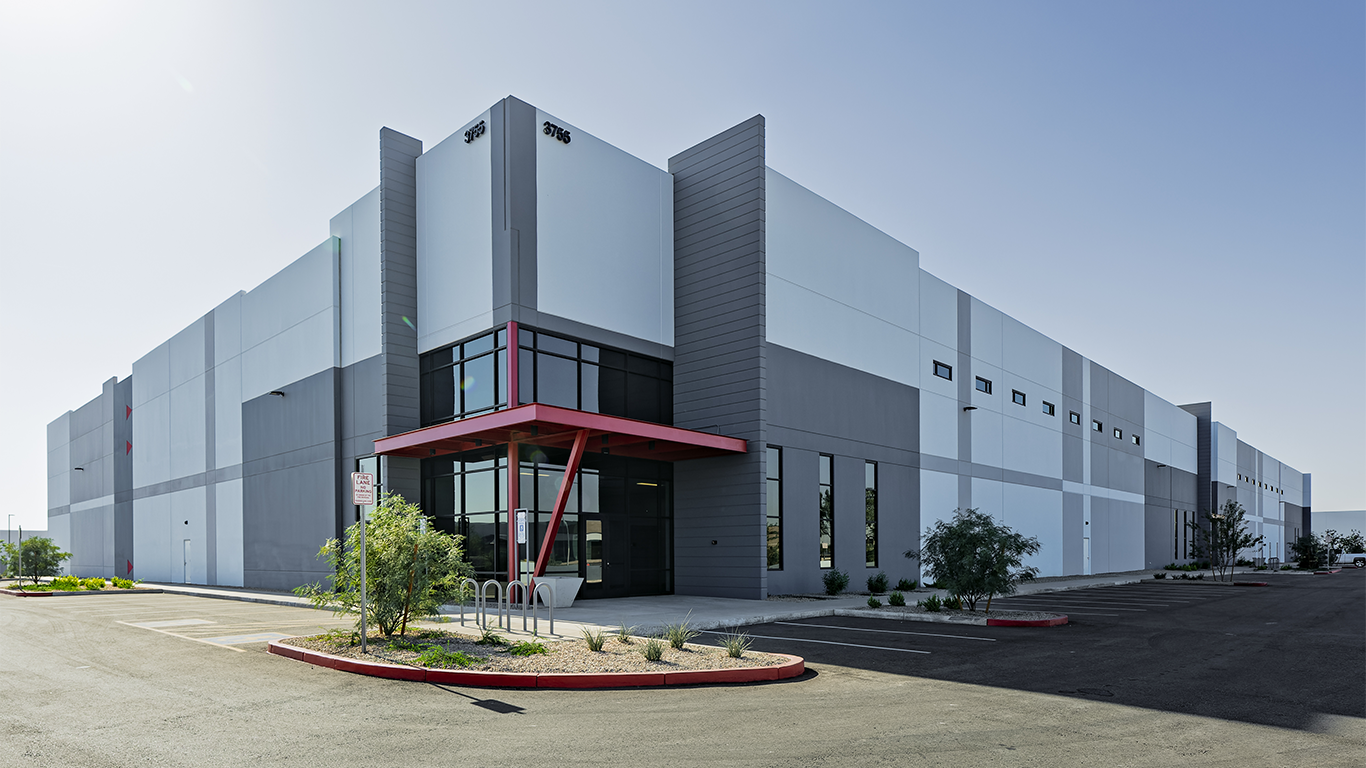
Industrial markets in the Western U.S. ended 2024 amid a mix of resilience and market challenges. While most Western hubs maintained vacancy rates below the 8% national average, others faced rising vacancies as new supply hit the market, according to our latest industrial report.
RELATED NEWS: 2,069-acre parcel will become a $20 billion data center park in Buckeye
GET THE LATEST NEWS: Subscribe for free to get AZ Big Media’s newsletter
Orange County remained the most in-demand industrial market nationwide, with just 4.2% of its space available for lease, while Portland ranked as the sixth tightest at 6% vacancy. Meanwhile, vacancy rates surged in key Western logistics hubs, with Phoenix climbing 500 basis points year-over-year to 8.4%. Similarly, the Bay Area’s rate rose to 7.8%, up 360 basis points from last year.
Other key highlights:
- The West remained the most expensive region for industrial space, with all markets except the Central Valley exceeding the national average for in-place rents of $8.30/sq. ft. Orange County is the priciest industrial market in the U.S., with in-place rents reaching $16.20/sq. ft., followed by Los Angeles at $14.95/sq. ft.
- Phoenix and the Inland Empire recorded the widest lease spreads in the region, at $3.98 and $3.01/sq. ft., respectively.
- The Bay Area and Denver posted some of the lowest lease spreads nationally, at $0.24 and $0.92/sq. ft., reflecting a narrower pricing gap between in-place leases and those signed in the past 12 months.
- Phoenix remained the nation’s most active industrial development market, but its pipeline shrank significantly year-over-year, decreasing from 42.5M to 22.4M sq. ft.
National highlights:
- National in-place rents rose 6.6% Y-o-Y to $8.30 per sq. ft.
- The gap between in-place rents and new lease rates narrowed to $2.04 per sq. ft. in December, down from $2.50 six months ago
- The national industrial vacancy rate reached 8% in December, doubling from below 4% two years ago
- In 2024, 358M square feet of industrial space was delivered, a sharp decline from the 1B+ square feet completed in 2022-2023, but still a higher yearly total than any year before 2020
For more in-depth market insights, including vacancies and asking rates across the top 30 industrial markets, read our report here: https://www.commercialedge.com/blog/national-industrial-report/
You can also check our previous reports here.


