The increases in housing prices continued to reach new heights in May. The national price gain of 16.6 percent over the year was a record high for the S&P CoreLogic Case-Shiller report, released July 27. All metropolitan areas included in the report had double-digit increases in home prices year-over-year in May with Phoenix continuing to be at the top with a 25.9 percent gain in house prices followed by San Diego at 24.7 percent and Seattle at 23.4 percent. The 20-city composite posted a gain of 17.0 percent.
READ ALSO: Metro Phoenix homes sold $500K over asking price more than triple in Q2
Sierra Vista was one of the most affordable places in America during the second quarter as the NAHB/Wells Fargo Housing Opportunity Index indicated it had the third highest share of homes that were affordable for the local median income at 93.2 percent. Nationally, the share of new and existing homes affordable to families earning the U.S. median income of $79,900 was 56.6 percent in the second quarter 2021, down from 63.1 percent in the first quarter. Increased building costs, low inventory of homes and a high demand for housing all contributed to the decrease in affordability according to the National Association of Home Builders (NAHB). Affordability was lower in all Arizona metros when compared to the first quarter, some considerably so. Arizona metro areas that matched or were better than the nation in the second quarter were Lake Havasu City-Kingman at 56.6 percent, Tucson at 65.3 percent, Yuma at 71.1 percent and Sierra Vista-Douglas at 93.2 percent. Phoenix was just under the national share at 56.4 percent. At the lower end were Flagstaff at 47.5 percent and Prescott with the lowest at 39.4 percent. Prescott also had the steepest decline in affordability, moving from a share of 47.6 percent in the first quarter to 39.4 percent in the second quarter.
Second quarter 2021 U.S. real gross domestic product (Figure 1) increased at an annual rate of 6.5 percent based on the advance estimate from the Bureau of Economic Analysis, released July 29. The first quarter real GDP was revised to 6.3 percent. The release also included an annual update, which put 2020 real GDP at -3.4 percent.
Figure 1
Use your cursor as a tooltip to click titles ON/OFF at bottom of the chart. Run cursor over chart to view values.
Arizona had 818 bankruptcy filings in the month of July, continuing a below average number of bankruptcies for the year, Figure 2. Chapter 11 (reorganization) was the only type of bankruptcy to have a higher number of filings in July compared to the same month last year. Year-to-date, total bankruptcies were down 25.8 percent in the state. The Phoenix office down 27.6 percent year-to-date, the Tucson office down 21.1 percent and the Yuma office down 21.0 percent. The Phoenix office includes Apache, Coconino, Gila, Maricopa, Navajo, and Yavapai counties. The Tucson office handles Cochise, Graham, Greenlee, Pima, Pinal, and Santa Cruz counties, while the Yuma office represents La Paz, Mohave, and Yuma counties. Three counties (Greenlee, Santa Cruz, and La Paz) had one more bankruptcy than the prior year while the rest had the same number or lower.
Figure 2
Use your cursor as a tooltip to click titles ON/OFF at bottom of the chart. Run cursor over chart to view values.
The U.S. trade deficit widened in June to $75.7 billion compared to a revised May figure of $71.0 billion., Figure 3. Both imports and exports were up over the month, though imports increased more, moving to $283.4 billion for June. Exports were $207.7 billion for the month based on the joint Bureau of Economic Analysis and U.S. Census Bureau August 5 release. Year-to-date there was a 46.4 percent increase over the same period last year for the goods and services deficit.
Figure 3
Use your cursor as a tooltip to click titles ON/OFF at bottom of the chart. Run cursor over chart to view values.
U.S. total nonfarm employment was up 943,000 in July according to the August 6 Employment Situation report from the Bureau of Labor Statistics. Leisure and hospitality gained a notable amount of jobs over the month, as seen in Figure 4. The unemployment rate lowered to 5.4 percent in July. Unemployment rates were lower over the month for all education levels as well as White, Black or African American, Asian and Hispanic or Latino ethnicity. Note the 2021 preliminary benchmark revision to establishment survey data will be released August 18; the final benchmark revision will be released in February 2022.
Figure 4: Employment Change by Industry With Confidence Intervals, July 2021
(seasonally adjusted in thousands, 1-month net change)

CURRENT DATA RELEASES AS OF 9 JULY 2021
Arizona bankruptcy filings have not reached 1,000 in a single month this year. There were just 881 bankruptcies in the state during June, 21.5 percent fewer than the same month last year. Every type of filing was unchanged or lower in June compared to a year ago. Year-to-date, total bankruptcies were down 25.4 percent with the Phoenix office down 27.1 percent year-to-date, the Tucson office down 20.8 percent and the Yuma office also down 20.4 percent. The Phoenix office includes Apache, Coconino, Gila, Maricopa, Navajo, and Yavapai counties. The Tucson office handles Cochise, Graham, Greenlee, Pima, Pinal, and Santa Cruz counties, while the Yuma office represents La Paz, Mohave, and Yuma counties.
The May trade deficit for the U.S. was up $2.2 billion over the month at $71.2 billion. Both imports and exports were higher over the month; however, imports rose much more than exports. Imports increased $3.5 billion to $277.3 billion in May while exports increased $1.3 billion for the month to come in at $206.0 billion. Year-to-date, the goods and services deficit increased 45.8 percent over the same period in 2020 according to the joint U.S. Census Bureau and U.S. Bureau of Economic Analysis release on July 2.
House prices surged in April and Phoenix lead the pack with a 22.3 percent increase in prices over the same month a year ago according to the S&P CoreLogic Case-Shiller Index released June 29. The national home price index posted a 14.6 percent gain in home prices over the year compared to 13.3 percent for March. The 20-city composite had a 14.9 percent increase year-over-year. Besides Phoenix, two other metropolitan areas posted one-year price gains of over 20 percent. These were San Diego at 21.6 percent and Seattle at 20.2 percent. Only one metro that had less than a two-digit increase and that was Chicago at 9.9 percent.
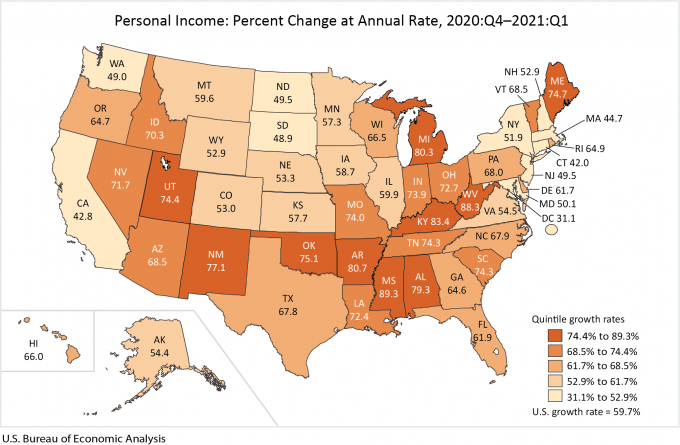
State personal income for Arizona increased at an annual rate of 68.5 percent in the first quarter 2021, Figure 5. The U.S. growth rate was 59.7 percent for the quarter and changes in personal income ranged from 31.1 percent in the District of Columbia to 89.3 percent in Mississippi according to the Bureau of Economic Analysis June 22 release.
Figure 5
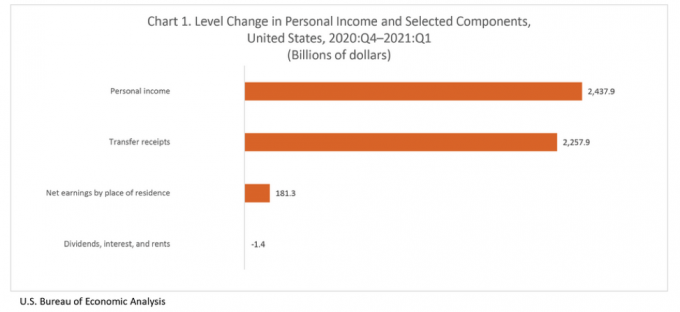
These increases in state personal income were due to a rise in transfer receipts (Figure 6), primarily reflecting government pandemic relief payments. Government assistance payments, such as direct economic impact payments, expanded unemployment benefits, and Paycheck Protection Program loans, were distributed to households and businesses through the Coronavirus Response and Relief Supplemental Appropriations Act and the American Rescue Plan Act.
Figure 6
Arizona ranked 40 out of all states in the most recent 2021 KIDS COUNT Data Book released June 21. Arizona has consistently ranked in the lower portion of states with the 2020 rank at 42. The rankings are a composite of 16 indicators, four each within these four categories: economic well-being, education, health, and family and community. Arizona ranked highest for the health category at 28, an improvement from the 2020 ranking of 33, though the measures that make up the category were a mixed bag compared to the U.S. as well as how the state has done over time (some better, some worse). Arizona improved in all economic well-being measures as well as its rank in that category, which moved up one to 35 for 2021. Most measures in the education category improved over time; however, that did not keep up with the rest of the country resulting in a slight drop in rank to 47. Arizona rank for family and community category remained the same at 46. The Annie E. Casey Foundation has been reporting on the condition of the nation’s children since 1990 and the top three states for 2021, Massachusetts, New Hampshire, and Minnesota, have consistently been among the top states for children’s well-being over time.
Valorie Rice is the Senior Business Information Specialist at the Economic and Business Research Center (EBRC) in the University of Arizona’s Eller College of Management.