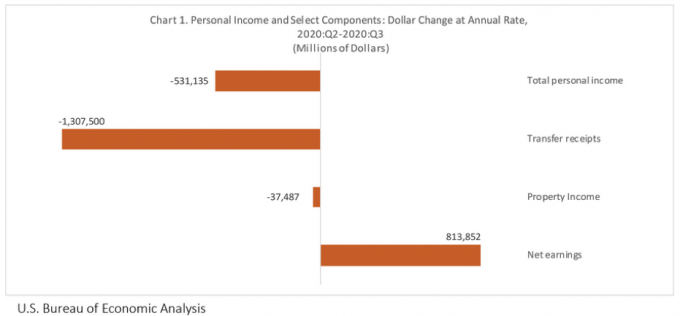
Arizona state personal income decreased at an annual rate of 8.6 percent between the second quarter and third quarter 2020. Nationally state personal income decreased 10.0 for the quarter according to the December 17 Bureau of Economic Analysis release. Personal income decreased in every state, ranging from -0.6 percent in Georgia down to -29.9 percent in West Virginia. Decreases in transfer receipts (such as retirement benefits and unemployment insurance) and property income (dividends, interest and rent) were larger than increases in net earnings for the quarter. Transfer receipts decreased $1.3 trillion for the nation in the third quarter as CARES Act payments eased and temporary increases in unemployment benefits expired.
Arizona house price increases were among the top in the nation in the third quarter. One-year price appreciation in Arizona was 11.1 percent in the third quarter 2020, topped only by Idaho at 14.4 percent. The purchase-only price increase for the nation during that period was 7.8 percent according to the Federal Housing Finance Agency (FHFA) House Price Index quarterly report released November 24. Arizona metropolitan areas proved to be near the top as well based on all-transaction data (which includes purchase and refinance mortgages). Ranked metropolitan area data placed Lake Havasu City-Kingman 9th in the nation at a one-year increase of 8.4 percent followed by Phoenix in 10th at an 8.3 percent increase in house prices. Tucson showed up at 17th place with 7.2 percent increase. Other one-year price appreciation in Arizona were 5.2 percent in Flagstaff, 6.3 percent in Prescott Valley-Prescott, 5.2 percent in Sierra Vista-Douglas, and 7.7 percent in Yuma.
The Census Bureau released new 2019 American Community Survey 5-year estimates on December 10. This is the first time the 5-year estimates allow users to compare three sets of data (2005-2009, 2010-2014, and 2015-2019) for areas down to small population sizes. The percent of the population with a bachelor’s degree or higher increased 2.8 percentage points to 32.1 percent for the nation and went up 2.4 percentage points to 29.5 percent for Arizona. The interactive map below provided by the Census Bureau allows users to zero in on a specific county to compare over time.
[https://www.census.gov/library/visualizations/interactive/acs-percentage-bachelors-degree-2015-2019.html]
Arizona nonfarm employment gained 27,700 jobs in November, but job growth over the year was down 2.8 percent. There were three sectors posting a year-over-year increase in employment, which were trade, transportation and utilities; construction; and financial activities. All other sectors have fewer jobs than this time last year. All Arizona metropolitan areas had year-over-year employment decreases at Prescott -0.4 percent, Sierra Vista -0.9 percent, Phoenix -2.6 percent, Tucson -3.7 percent, Lake Havasu City-Kingman -3.9 percent, Yuma -5.8 percent, and -16.9 percent in Flagstaff. Arizona’s seasonally adjusted unemployment rate ticked down 0.1 to 7.8 percent according to the Arizona Office of Economic Opportunity December 17 release.
Unemployment rates were lower or stable in most states in November with only seven states having an increase. Arizona unemployment rate lowered slightly to 7.8 percent compared to 7.9 percent in October. According to the December 18 Bureau of Labor Statistics release for State Employment and Unemployment, three states had double-digit unemployment rates in November: New Jersey at 10.2 percent, and Hawaii and Nevada at 10.1 percent each. The lowest unemployment rate was found in Nebraska and Vermont, both with 3.1 percent. The U.S seasonally adjusted unemployment rate for November was 6.7 percent.
The Bureau of Economic Analysis released Real Personal Income by State and Metropolitan Area, 2019 on December 15. This report provides current-dollar personal income adjusted by the state’s regional price parity and the national personal consumption expenditures price index. Arizona’s real personal income for 2019 increased 3.6 percent, which placed it among the states with the highest increase. The change in real personal income for states ranged from 4.1 percent in Maine down to 0.7 percent in Hawaii. The report also includes regional price parities, which reflects differences in price levels across states and metropolitan areas compared to the nation. States with the largest price parities are Hawaii, California, New York, and New Jersey, all of which have a 16 percent or higher cost of living than the U.S. On the other end of the spectrum, Mississippi has 15.6 percent lower prices than the nation. Arizona’s costs are 3.7 percent lower than the nation.
Arizona Office of Economic Opportunity released provisional Arizona July 1, 2020 population estimates for the state, counties and incorporated areas. The estimates are provisional, as they will be updated once 2020 Census are released in a few months. Arizona population estimate of 7,294,587 for 2020 was a 1.5 percent increase over 2019 population estimate. Pinal County grew the most, increasing 2.8 percent while Coconino County population decreased by 1.3 percent. Queen Creek, which straddles Pinal and Maricopa counties, was the fastest growing incorporated place.
The Consumer Price Index rose 0.2 percent in November on a seasonally adjusted basis according to the December 10 Bureau of Labor Statistics release. No single component stood out for the month, as increases were broad-based. The energy index rose due to increases in natural gas and electricity while food at home prices declined and food away from home increased slightly. The index for all items less food and energy increased 0.2 percent after being unchanged in October. The annual inflation rate for November was 1.2 percent before seasonal adjustment.
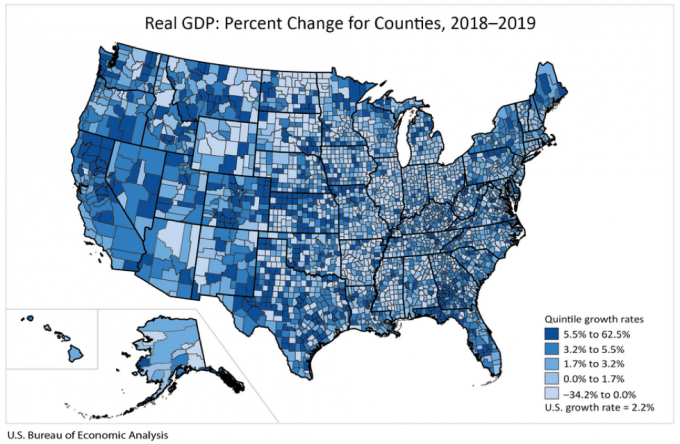
The increase in real GDP by County in 2019 for Arizona ranged from 8.1 percent in Graham County to -3.5 percent in both Coconino and Apache counties. GDP is the value of goods and services produced within a county. As expected the two largest counties in the state, Maricopa and Pima, also have the largest GDP. The percent change in GDP during 2019 for Maricopa and Pima was 3.3 percent and 2.8 percent, respectively. The U.S. growth rate for this period was 2.2 percent.
Arizona bankruptcy filings continued to decline in November with only 894 filings for the month, 21.8 percent fewer than the same month a year ago. Bankruptcies have decreased every month so far in 2020 with year-to-date filings down 20.3 percent. Chapter 13 (individual debt adjustment) is down 37.8 percent in Arizona year-to-date while Chapter 7 (liquidation) is down 16.3 percent and Chapter 11 (reorganization) is down 15.8 percent. Year-to-date the Phoenix office is down 19.2 percent, the Tucson office down 25.3 percent, and the Yuma office down 12.3 percent. Only Apache and Gila counties, both reporting to the Phoenix office, have year-to-date increases in bankruptcy filings at 21.1 percent and 3.4 percent, respectively. The Phoenix office includes Apache, Coconino, Gila, Maricopa, Navajo, and Yavapai counties. The Tucson office handles Cochise, Graham, Greenlee, Pima, Pinal, and Santa Cruz counties, while the Yuma office represents La Paz, Mohave, and Yuma counties.
The U.S. trade deficit increased $1.0 billion in October to $63.1 billion for the month compared to the revised September figure. Both exports and imports grew in October with exports increasing $4.0 billion to $182.0. Imports increased by $5.0 billion over-the-month to $245.1 billion. The year-to-date deficit of goods and services was 9.5 percent higher than the same period in 2019 according to the December 4 joint release from the U.S. Census Bureau and the U.S. Bureau of Economic Analysis.
U.S. nonfarm payroll employment grew by 245,000 jobs in November. Jobs in government and retail trade decreased for the month while employment gains happened in transportation and warehousing, professional and business services, and health care. September employment figures were revised upward while October data were revised down for a combined 11,000 more jobs than previously reported according to the December 4 Bureau of Labor Statistics release. The November seasonal adjusted unemployment rate ticked down to 6.7 percent from 6.9 percent in October.
Valorie Rice is the Senior Business Information Specialist at the Economic and Business Research Center (EBRC) in the University of Arizona’s Eller College of Management.