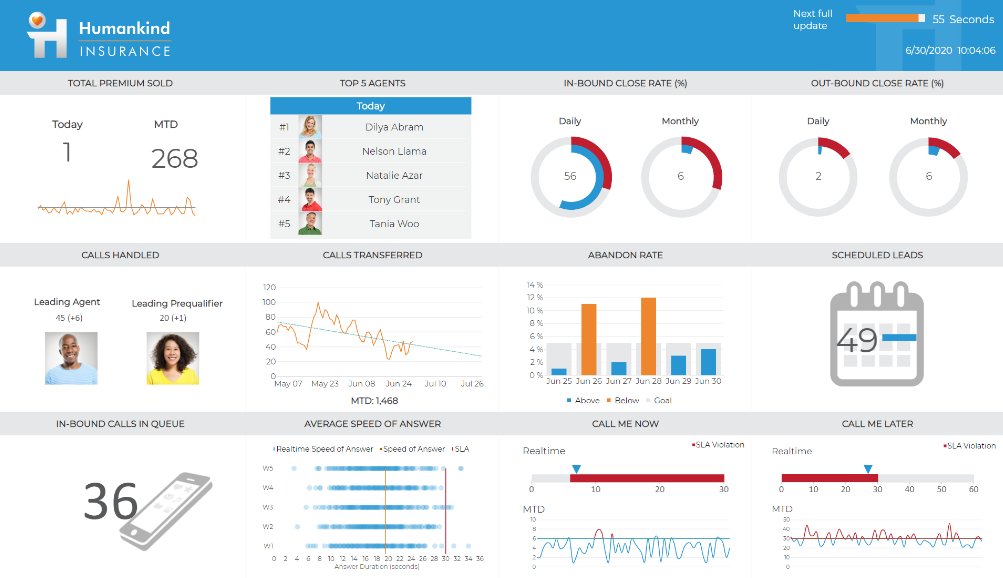
When you want to know how your business is doing in real time, you need to use innovative dashboard reporting. By analyzing and visualizing your data, you can easily identify trends and make important business decisions.

Develop an innovative dashboard report
Investing in a professional reporting dashboard tool will yield fresh business insights. It can also increase your company’s efficiency and speed. Whether you are an advertising executive or an HR manager, you will find innovative solutions that can help you manage your workforce, nurture customer relationships and monitor your business.
Dashboard reporting is a way to visualize your key performance indicators (KPIs) and monitor your progress. You can use the reports to identify areas of immediate attention, evaluate trends, and identify business opportunities. They are especially useful for measuring your company’s performance in real time.
The data you gather is the most powerful force behind business decisions. However, it can be overwhelming to analyze and interpret. A dashboard is an easy-to-use, visual representation of the data. With a dashboard, you can focus on the meaning of the data.
Identifying trends in the business world
Innovative dashboard reporting helps organizations identify and monitor key business metrics. These tools can help you make the right decisions at the right time, allowing you to focus on what matters most. This includes customer satisfaction and customer retention, which are two of the most important aspects of a modern-day enterprise. By putting data to work for you, you will be able to streamline your processes and take your business to the next level.
In fact, one of the best things about dashboards is their ability to show you the big picture. For instance, you can use a dashboard to track your performance against your sales goals. It is also a useful way to track customer feedback and churn rates. Additionally, you can use a dashboard to plan your next marketing campaign.
Creating a visual representation of all business data
Dashboarding is a tool that helps businesses to visualize their data. This allows them to make better business decisions. The visualizations also help people understand the relationship between the data and what it means to the organization.
Data dashboards are easy to use and provide quick insights. However, they need to be properly designed to be effective. A dashboard that fails to use the most basic of design best practices will be difficult to read and may cause more problems than it solves.
When deciding which type of dashboard is right for your business, the first step is to define what information you want to visualize. Some dashboards will offer various types of visualizations, such as bubble charts, graphs, scatter plots, and heatmaps.
It is important to choose dashboards with a clean and simple view. While it is possible to create dashboards with multiple visuals, this can cause a cluttered design.
In-the-moment performance measurement
A real-time dashboard is a graphical user interface that allows you to quickly visualize key performance indicators (KPIs). You can use dashboards to make critical business decisions based on factual information. They can also provide insight into your production and delivery.
In order to create a good dashboard, you should understand how performance is measured. There are two main ways to measure performance: as a control and as accountability. Both approaches have advantages and disadvantages. However, both can help you to improve the quality of your organization.
If you want to build a dashboard, you should ask yourself what metrics are important to you. You should also identify which data is necessary for your dashboard to be effective. The right metrics can help you make strategic decisions more efficiently.
Receive dashboard reports 24 hours a day, 7 days a week
If you’re looking for a cool way to visualize your data, then a dashboard might be the way to go. Not only will it help you find your most valuable assets, it will also save you money in the long run. Using a dashboard is not only a great way to get everyone’s attention; it also allows you to share reports with colleagues at a moment’s notice.
As well as the dashboard, your company could benefit from a reputable business intelligence solution that includes an integrated reporting system. This way, you’ll be able to view data from your countless sources and create reports that span the spectrum from your most basic sales figures to your most critical customer segments. A BI solution will also be able to deliver the reports to you in a variety of formats.
Conclusions
If you are planning to create an effective dashboard reporting system, then you should be aware of some important considerations. Dashboards are a powerful tool that can help to improve transparency and accountability. But they can also bring about some major risks. Therefore, you need to be prepared for all eventualities.
The dashboards you create need to have a proper design. This is especially true when they are based on big data. A poor design could result in misinformation and misunderstanding.
You must also consider the various kinds of users who will access the dashboard. For instance, the elderly might find it difficult to use new technologies. Moreover, you need to ensure that the dashboard will provide them with the information they need.
In addition to providing an overview, your dashboard should provide them with an opportunity to zoom in on details. When a user is provided with the ability to see the whole picture, they will be more likely to make the right decision.


