
The Phoenix metropolitan statistical area (MSA) Consumer Prices Index for All Urban Consumers (CPIU) for all items rose 11.0% over the year in April, much faster than the U.S. So, Why is Phoenix inflation skyrocketing?
As you are no doubt aware, prices in the U.S. have been rising at a very rapid rate during the past year. The U.S. CPIU for all items (nonseasonally adjusted) was up 8.3% over the year in April 2022 and rose even faster in May (up 8.6%). These data are published by the U.S. Bureau of Labor Statistics (BLS). For the U.S. they are published monthly.
READ ALSO: Metro Phoenix No. 1 in the nation for highest inflation
The all-items index is designed to reflect the change in prices for goods and services that U.S. consumers normally purchase. This “market basket” is defined through a survey of U.S. consumers and is periodically updated to capture changes in behavior. Think of the all-items index as a weighted average price, where the weights are determined by the share of spending on a given item (or group of items) in the average U.S. consumer’s total spending.
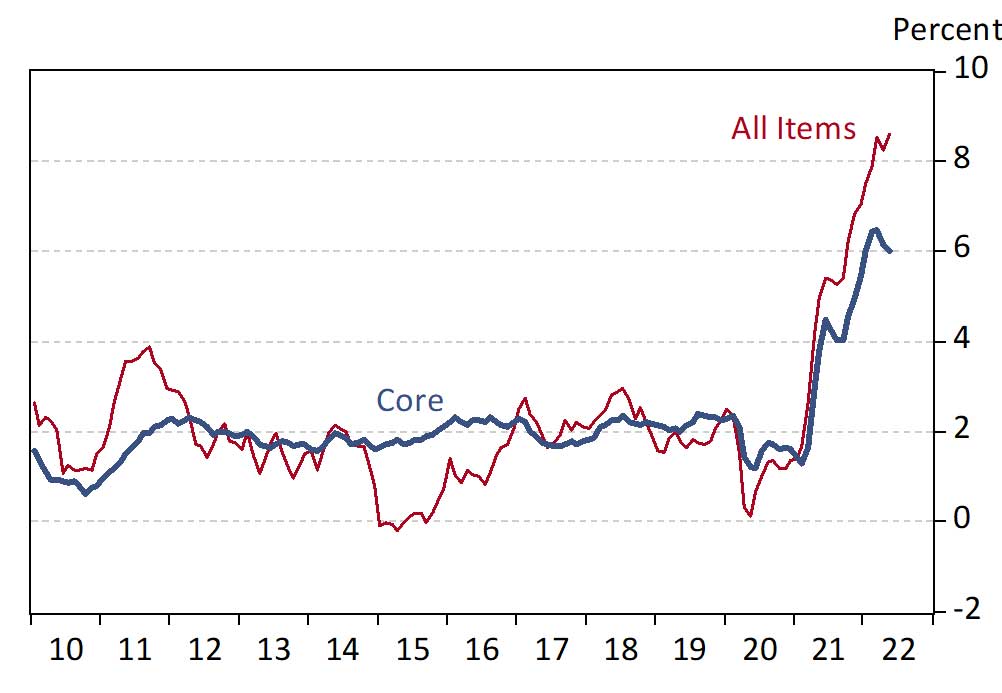
The all-items data break down into more detailed components. For instance, a popular measure of core inflation is the all-items index less food and energy. This is thought to give a better measure of inflation from the perspective of monetary policymakers, since energy and food prices are very volatile and their main drivers are difficult for monetary policy to influence. As Exhibit 1 shows, core inflation has accelerated significantly as well. Core inflation was up 6.2% over the year in April 2022 but cooled slightly to 6.0% in May.
Exhibit 1: U.S. Inflation Is Still Running Hot, U.S. All-Items and Core CPIU, Over the Year, Percent
While the BLS does not publish CPIU data for states, it does publish for large metropolitan statistical areas (MSAs) and Census regions. The BLS currently publishes data for the Phoenix MSA (Maricopa and Pinal counties) on even-numbered months.
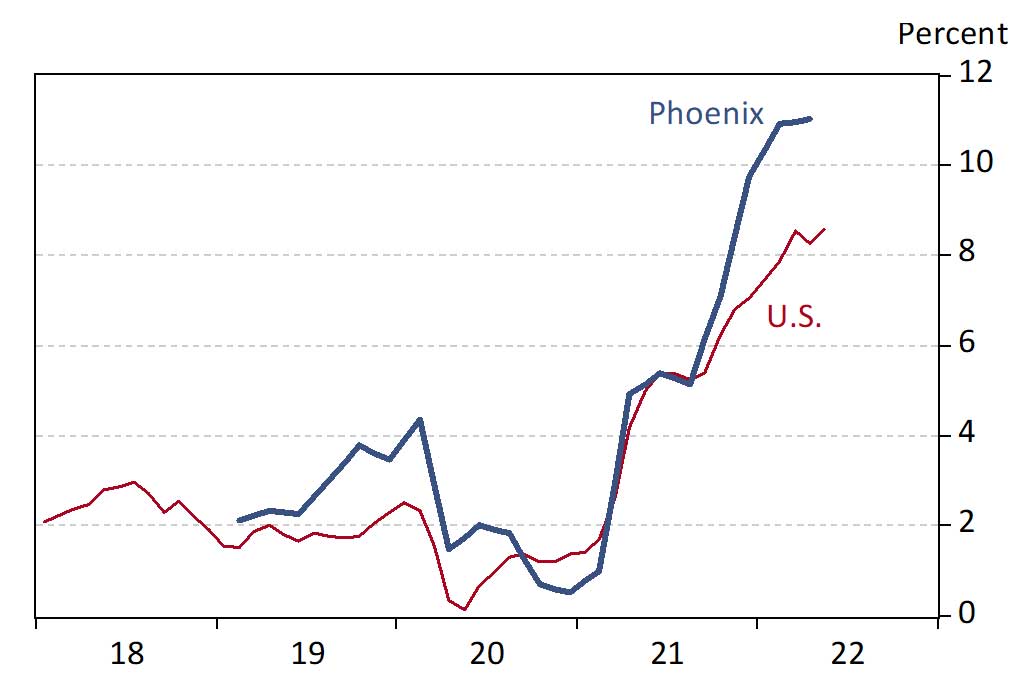
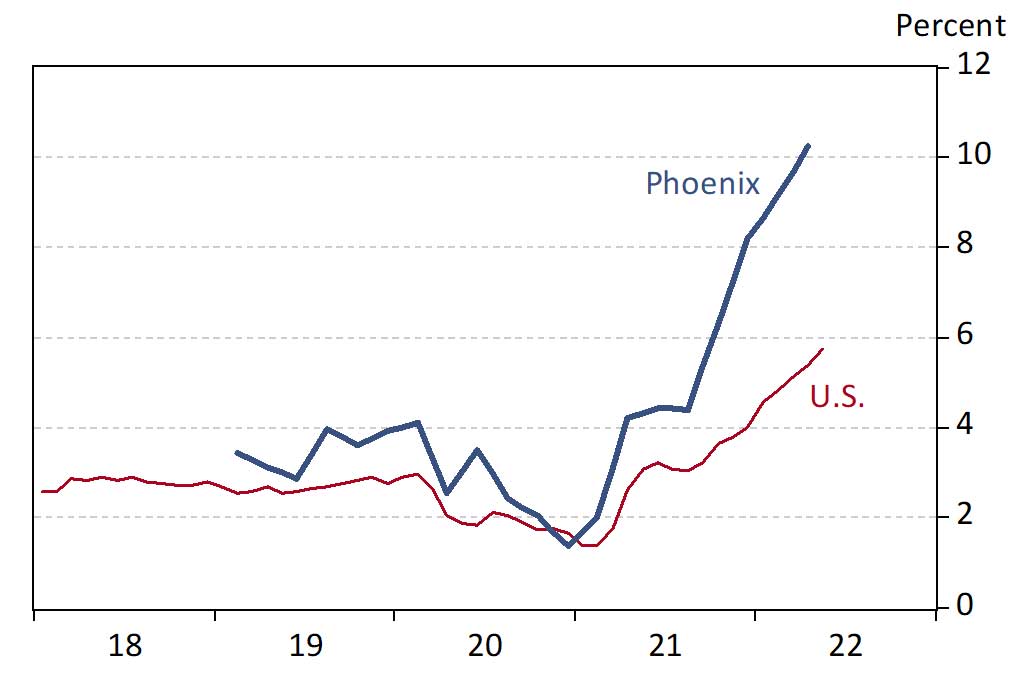
As Exhibit 2 shows, inflation has been running even faster in Phoenix, with the all-items CPIU up 11.0% over the year in April, compared to 8.3% nationally (nonseasonally adjusted). Note that it is not unusual for inflation in Phoenix to outpace the U.S.
Exhibit 2: Phoenix and U.S. All-Items Inflation, Over the Year, in Percent
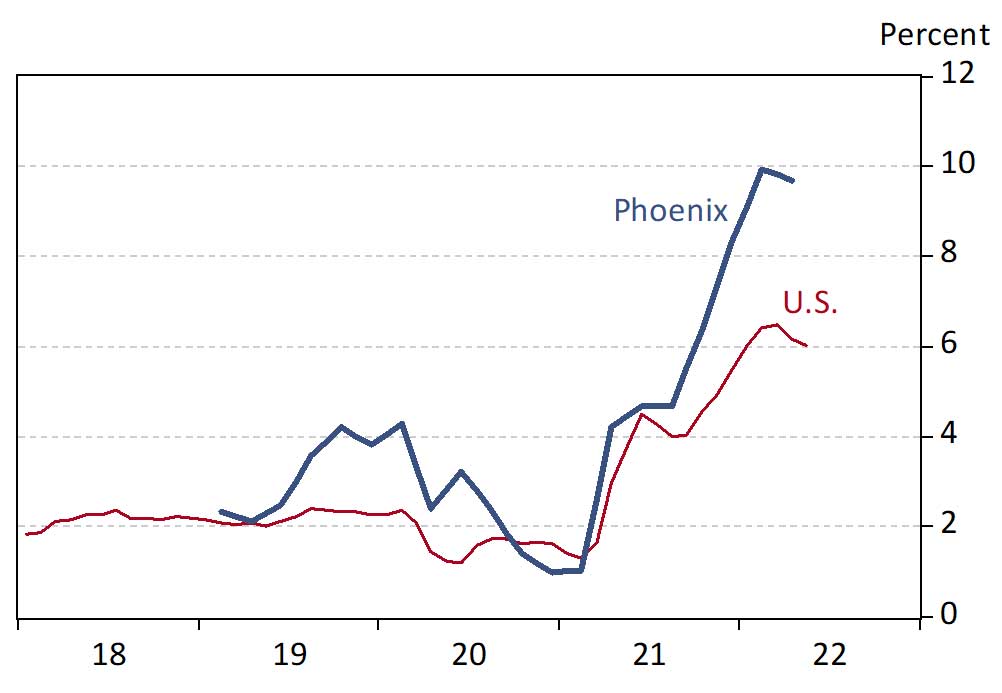
Drilling down into the all-items index, Exhibit 3 shows that core inflation in Phoenix was even further above the national rate than was the all-items index. In Phoenix, the CPIU for all items less food and energy was up 9.7% over the year in April, compared to 6.2% for the U.S.
Exhibit 3: Phoenix and U.S. Core Inflation, Over the Year, in Percent
The all-items index breaks down in a number of ways, also regularly published by the BLS. One breakdown is into two categories: commodities and services. Commodities include tangible goods, like vehicles, apparel, appliances, gas, etc. Services include intangible goods, like housing, health care, travel, education, etc. Note that housing services include rentals as well as owner-occupied units. The idea is that the CPIU tracks the cost of owner-occupied housing services through owners-equivalent rent while excluding the asset component of home ownership.
Exhibit 4 shows inflation in commodities for the U.S. and Phoenix. Note that commodities prices have been rising at about the same pace in Phoenix as they have nationally. Over the year in April, commodities prices were up 12.3% in Phoenix and 12.9% nationally.
Exhibit 4: Phoenix and U.S. Commodities Inflation, Over the Year, in Percent
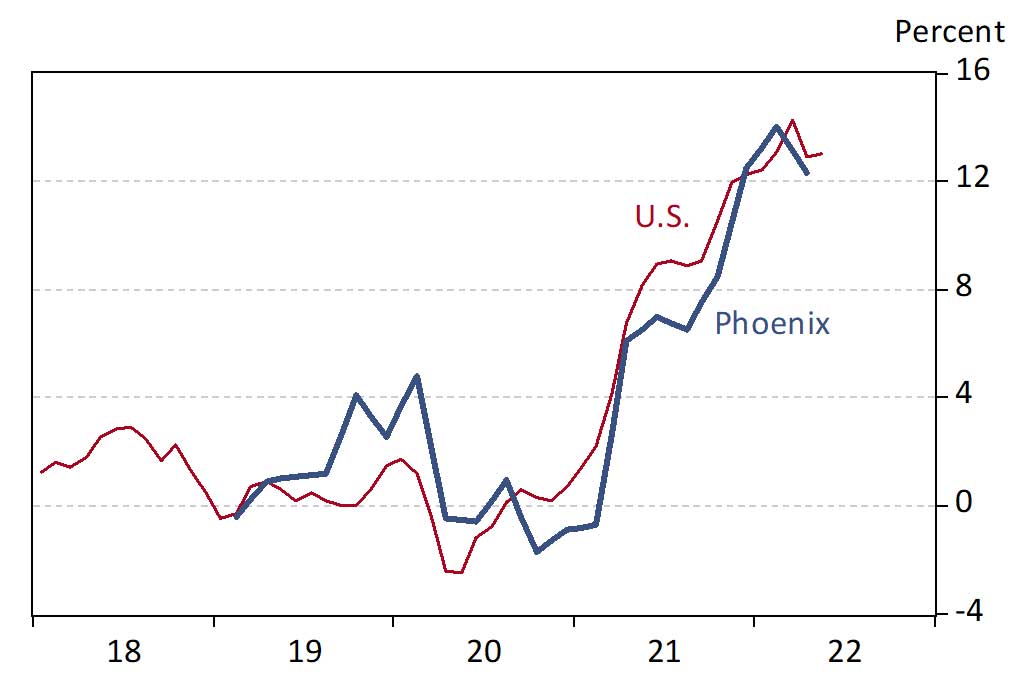
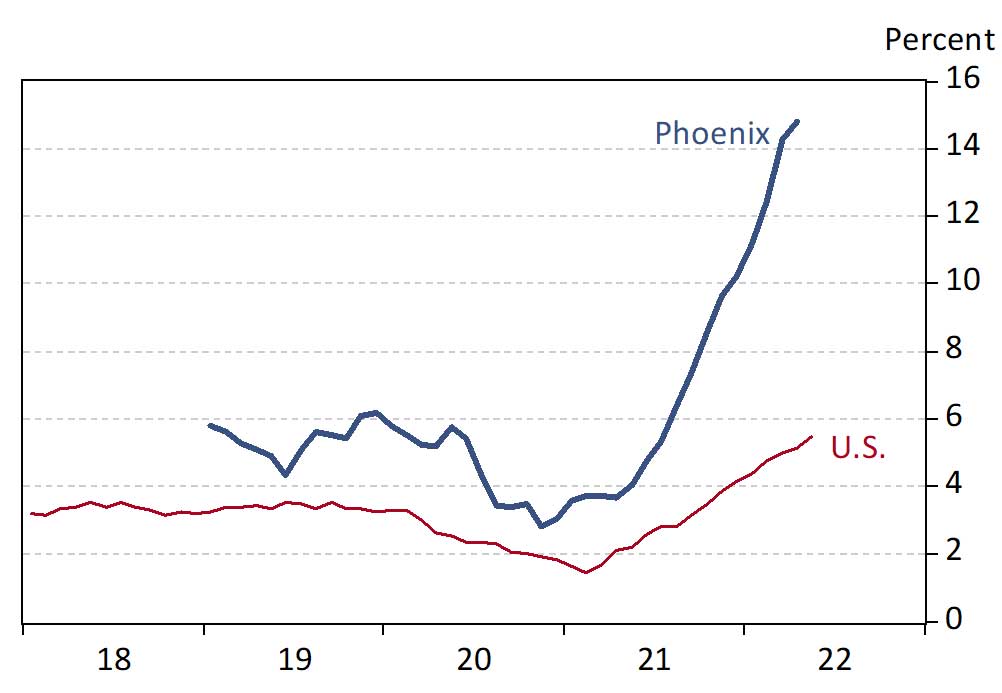
Exhibit 5 shows that services inflation in Phoenix has far exceeded the national pace since the middle of 2021. In April, services prices rose 10.2% over the year in Phoenix, compared to 5.4% nationally.
Exhibit 5: Phoenix and U.S. Services Inflation, Over the Year, in Percent
Why have services prices been rising so much faster in Phoenix? Shelter. Exhibit 6 shows shelter inflation for Phoenix and the U.S. Shelter includes rental and owner-occupied housing, as well as lodging away from home and tenant and household insurance. Shelter prices in Phoenix rose 14.8% over the year in April, compared to 5.1% nationally.
The cost of shelter is a very large component of consumer spending, generally accounting for one-third of the total. This makes spikes in house prices (which eventually show up in elevated owners’ equivalent rent) and rents a potent source of consumer price inflation.
Exhibit 6: Phoenix and U.S. Shelter Inflation, Over the Year, in Percent
George W. Hammond, Ph.D., is the director and research professor at the Economic and Business Research Center (EBRC).