
As traders buy and sell at particular levels, price oscillates between these levels, resulting in price patterns that are visible on charts. Finally breaking through the price pattern might signal a dramatic shift in market mood.
Longer-term patterns tend to be more predictable, and when price breaks out of a pattern, it typically does so with greater changes. A pattern that emerges on a daily chart, as opposed to an intraday chart, such as a one-minute chart, is thus anticipated to cause a greater shift.
Although false breakouts frequently occur in crypto chart patterns, traders may boost their performance by validating breakouts with other indicators (such as RSI, MACD, and so on.) or even just a simple volume trend.
1. Ascending triangle
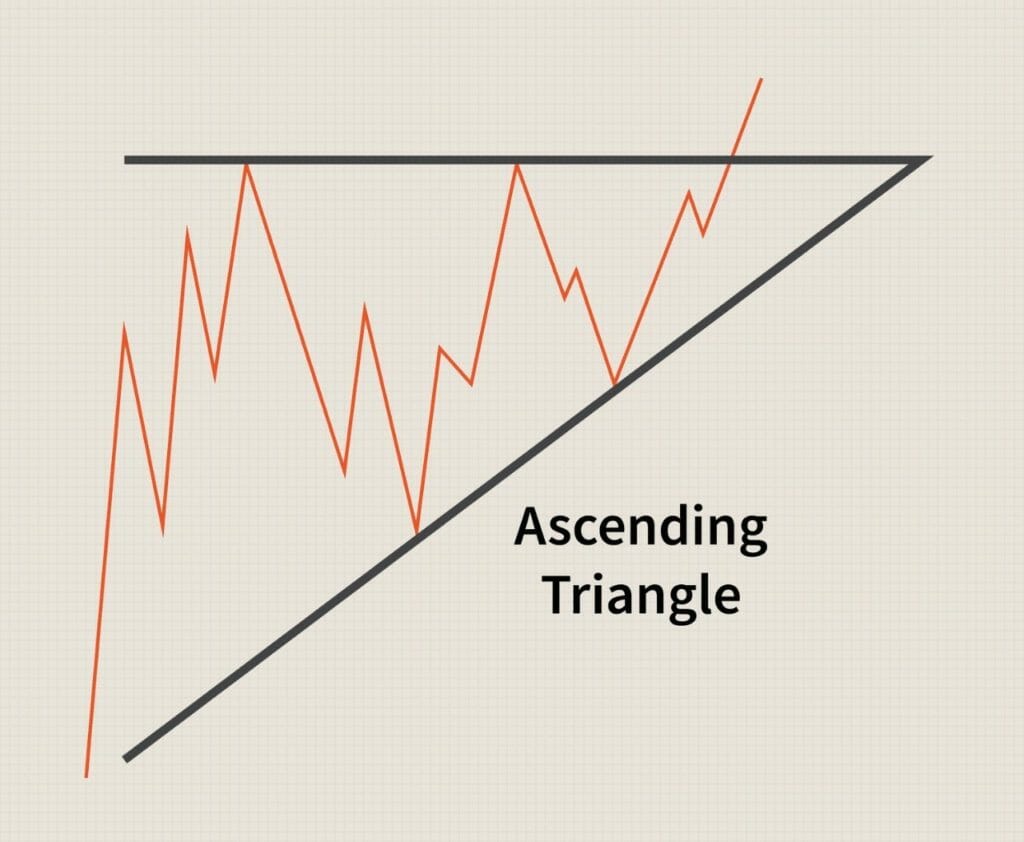
A horizontal line made up of two or more equal highs and two or more rising troughs intersects the horizontal line at the top. It frequently manifests during an uptick (bullish).
Trade: The present trend is frequently followed by a breakthrough. The majority of traders will open a position after the volume of the price movement passes the triangle’s top line; at this moment, the price should increase by an amount equal to the triangle’s widest part.
Using OGN as an example, the ascending triangle
2. Symmetrical triangles
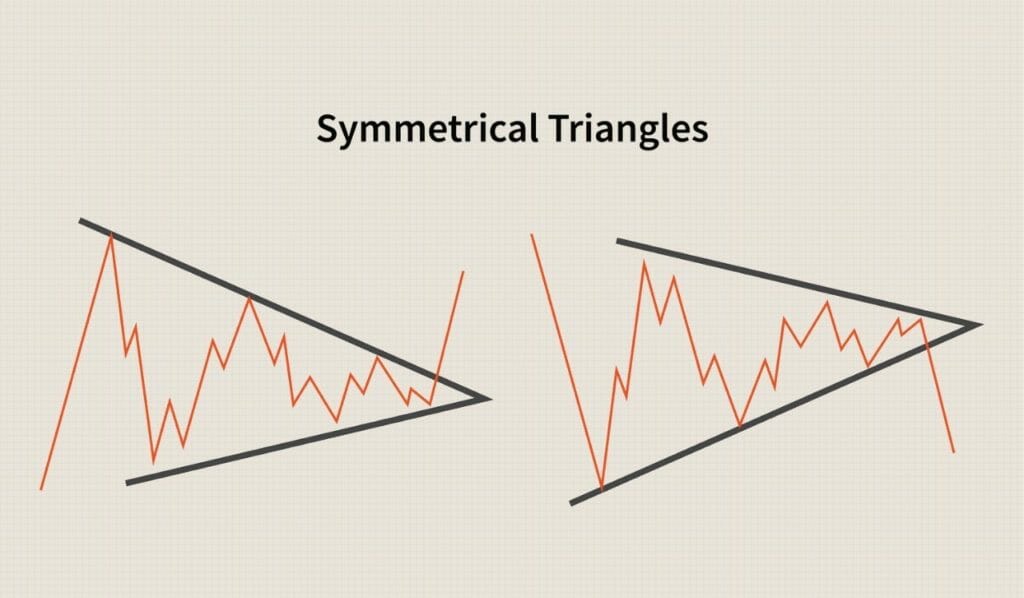
These patterns are continuations that show up in markets with hazy trends. The peaks and valleys of this uncertain time period converge at the low-volume triangle’s apex. Investors are just unclear about their position. When the market does decide to move, it does so in either a northward or a downward direction with substantial volume compared to the volume before the breakout.
Trade: Make trade in the breakout’s direction, which is typically a continuation of the previous, more general trend, at the breakout point.
An illustration is a Structure originating from a symmetrical triangle.
3. Descending triangle
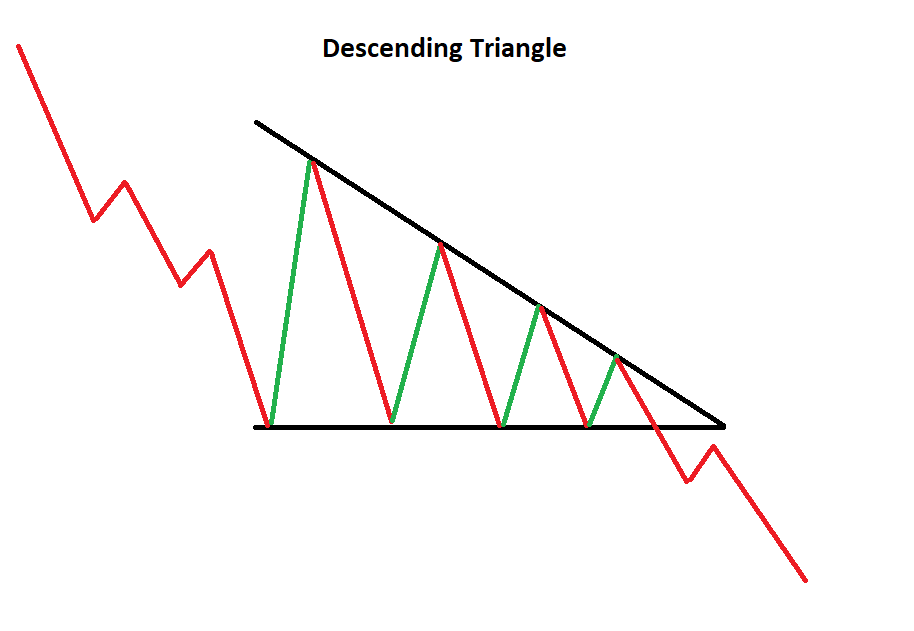
A horizontal line is created at the bottom by two or more equal lows, and it is intersected by a descending line made up of two or more ascending peaks. It frequently appears with a downturn (bearish).
Trade: The present trend is frequently followed by a breakthrough. The price should decrease by an amount equal to the triangle’s greatest component until the triangle’s bottom trendline is broken with increased volume, which is when the bulk of traders will initiate a trade.
Using the TNB emerging descending triangle as an example.
4. Head and shoulders
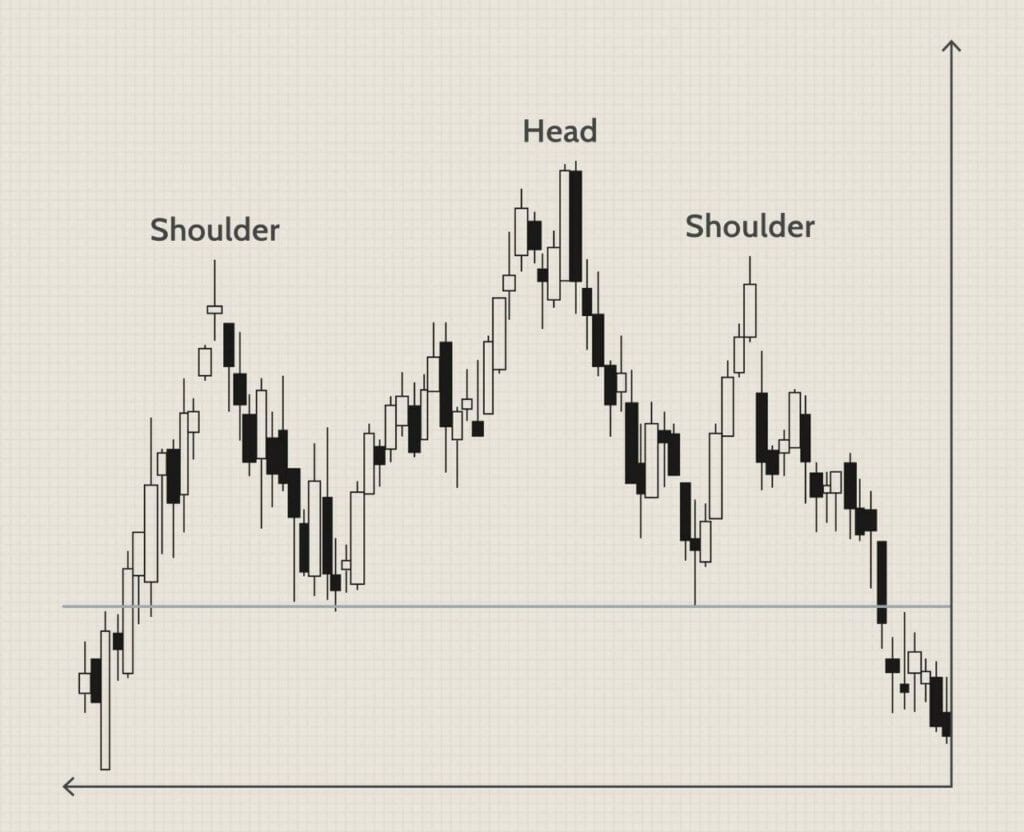
The biggest of the three peaks is in the middle, while the two summits on either side are smaller and about equal in height. It appears after a move forward and typically signals an oncoming trend reversal (from bullish to bearish). The head and shoulders formation is one of the best patterns indicating a trend reversal.
Trade: Wait until the price breaks out and moves lower than the neckline following the peak of the right shoulder. This indicates that the pattern is complete. When a breakout occurs, the neckline is breached, signaling a sell trade to be entered. The most frequent entrance point is this one.
5. Channel down and channel up
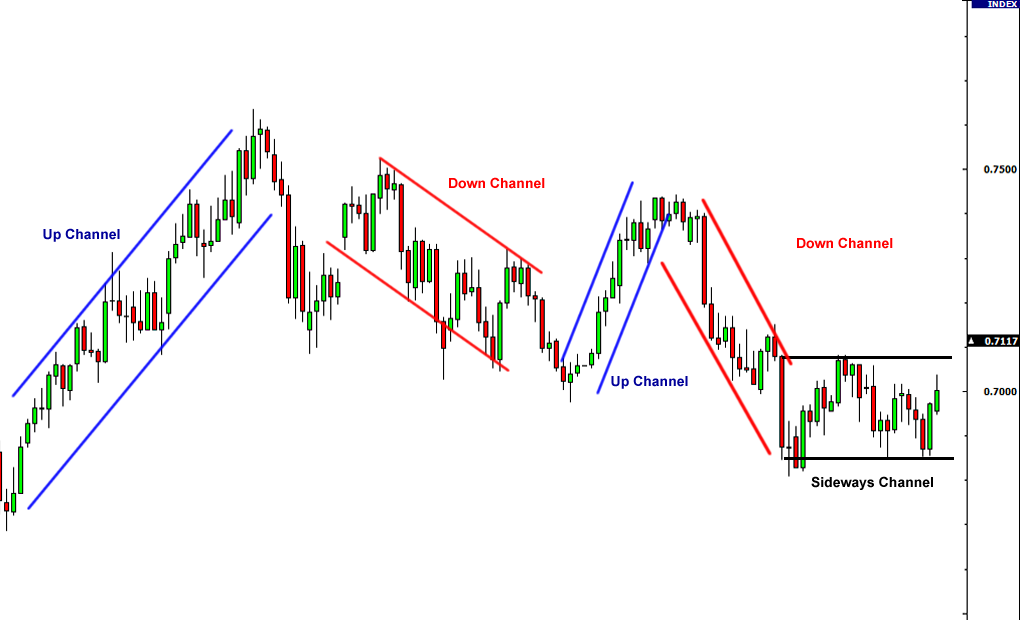
Trading range between two diagonal lines that are parallel. It becomes apparent when an uptrend or drop crosses parallel support and resistance lines. It suggests either a probable trend reversal or a change in the slope of the trend.
Trading: 1) When new patterns emerge, traders can place trades when they feel the price will likely stay within the trendlines of the channel; 2) When the price crosses the channel’s trendlines, either on the upper or lower side, traders can enter trades if the pattern is complete (i.e., a breakout). When this happens, the price can spike in the direction of the breakout.
BADGER, for example, rising from a Down Channel
6. Bullish and bearish flag
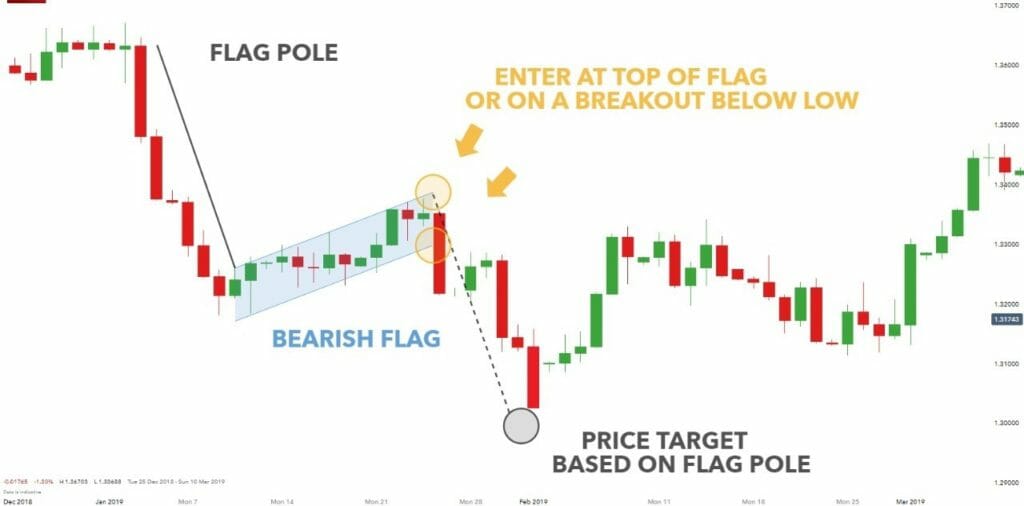
Over shorter periods of time, a small rectangular trading range exists between diagonal parallel lines. It goes in the opposite direction of the prevailing price trend shown on a price chart for a longer time frame. It typically appears following a sharp increase or decline and frequently indicates a small trend shift (or regions of consolidation) before the restoration of the former trend.
Flag patterns include bullish and bearish flags, among others (bearish flags). The flag pattern is one of the most reliable continuation patterns utilized by traders because it establishes a setup for joining a trend that is ready to continue.
Trade is initiated if a breakthrough occurs in the same direction as the current trend. Also, with bullish flag formations, traders like a breakout with an increase in volume, albeit it is not necessary. It’s possible that the breakout volume for bearish flag formations won’t change significantly from the volume that came before.
Example: OIN flag breakout
7. Rising wedge
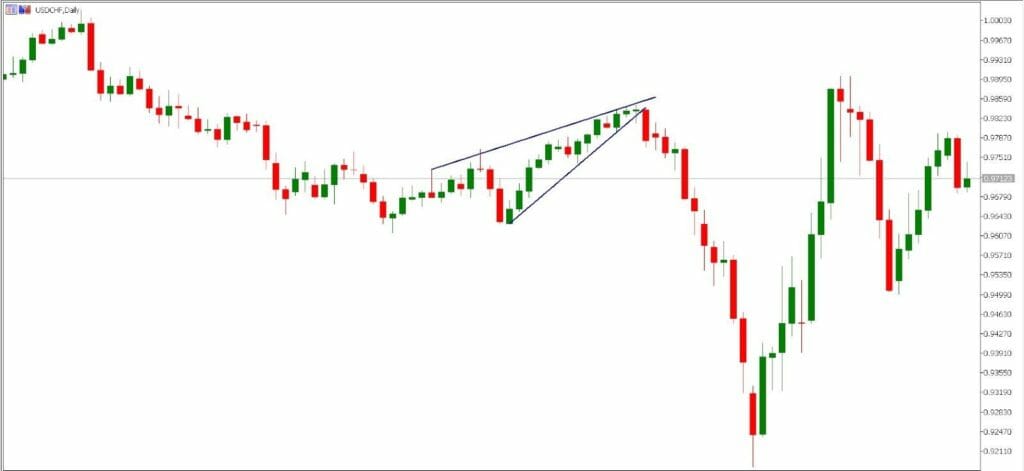
Two lines converge and slant upward. Although it may sometimes happen during a decline, it often occurs following an upswing. When the price progresses through the pattern, the volume often declines (price/volume divergence). Usually, a rising wedge causes a breakdown (bearish).
Swing traders can trade emerging patterns (prior to a breakout) between the convergence lines, but most traders should hold off until the pattern has finished and broken down before putting in a short sell order.
XMR, for instance, comes from the rising wedge.
10 Steps For Using Chart Patterns While Trading Cryptocurrencies
Key pointers on how to effectively trade using Chart Patterns include: Which crypto assets are used for pattern recognition?
- Choosing an interval of time
- Designs that are best for novices
- Developing patterns versus breakouts
- Rates of success for varied patterns
- Income potential
- The ideal moment to start a pattern trade
- When to sell a position
- Adhering to the trend
- Risk control