
Which states send the most workers to Arizona?
Though Arizona’s warm climate is often associated with drawing retirees from cooler regions, it serves as a hub of diverse opportunities that beckon workers from across the United States. The state’s magnetic allure extends beyond its weather, attracting a diverse spectrum of skilled and educated professionals from various states, thereby infusing the local workforce with fresh perspectives and expertise. By delving into the origins of migrants and workers, we can unveil not only which regions find Arizona most appealing but also highlight the cultural and skill-based currents flowing into the state.
LEARN MORE: Here are the Arizona labor market trends you need to know
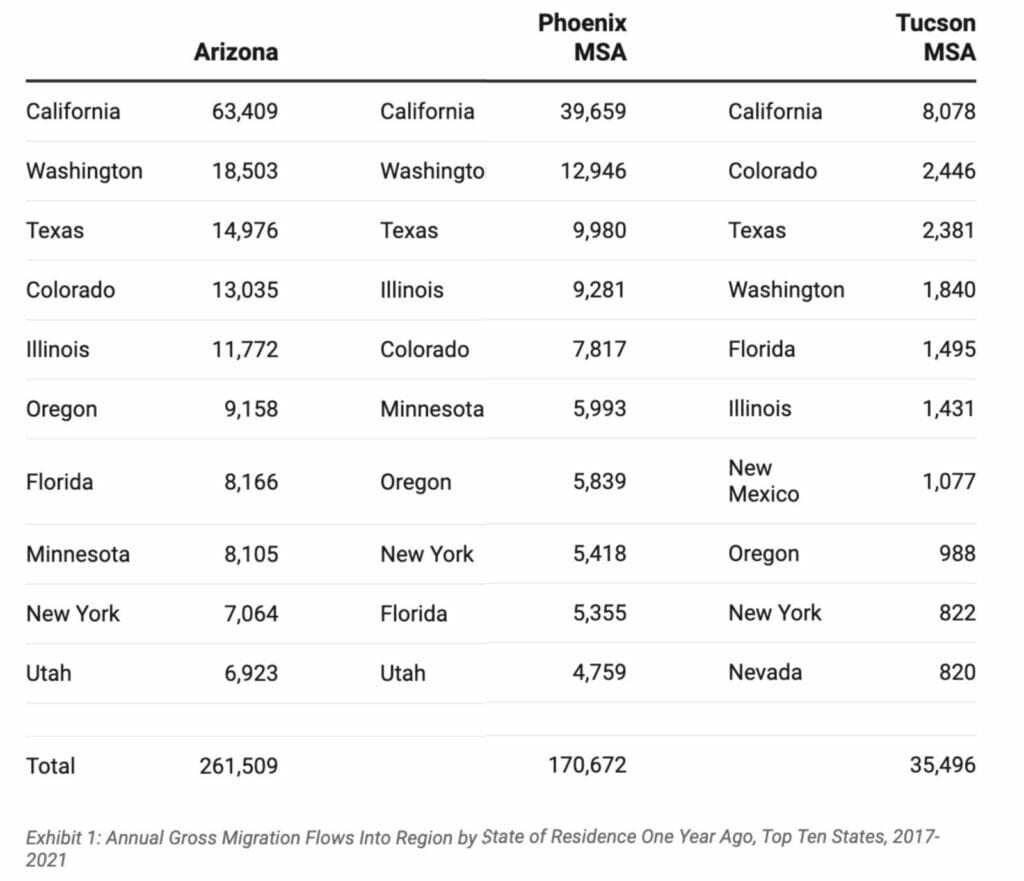
People move to Arizona for a plethora of reasons: jobs, retirement, or family ties. Exhibit 1 summarizes migration flows into Arizona, Phoenix, and Tucson from the American Community Survey Integrated Public Use Microdata Series (IPUMS). These are annual migration estimates based on a five-year survey from 2017-2021. California sent the most migrants to Arizona (24.2%), followed by Washington (7.1%), Texas (5.7%), and Colorado (5.0%). These estimates include all residents moving that were at least one year old.
Exhibit 1: Annual Gross Migration Flows Into Region by State of Residence One Year Ago, Top Ten States, 2017-2021
How many people specifically move to Arizona to work? The U.S. Census Bureau’s Longitudinal Employer-Household Dynamics (LEHD) program provides information on job flows that can help understand movements across states and metropolitan areas. The LEHD data arise from a linked employer-employee database.
Within the LEHD program, the Census tracks the movement of workers from job to job. This generates data on job transition rates, worker flows into and out of employment, and the movement of workers geographically. These data are known as J2J (job-to-job) flows and are available quarterly (with long lags) and are available for most states and many MSAs. Data on the geographic mobility of workers are known as job-to-job origin-destination data (J2JOD). The coverage of the data reflects the coverage of workers by state unemployment insurance systems. Note that this excludes federal government jobs. Furthermore, since many workers hold more than one job in a quarter, the Census identifies the worker’s main job using earnings. The highest paying job is the main job.”
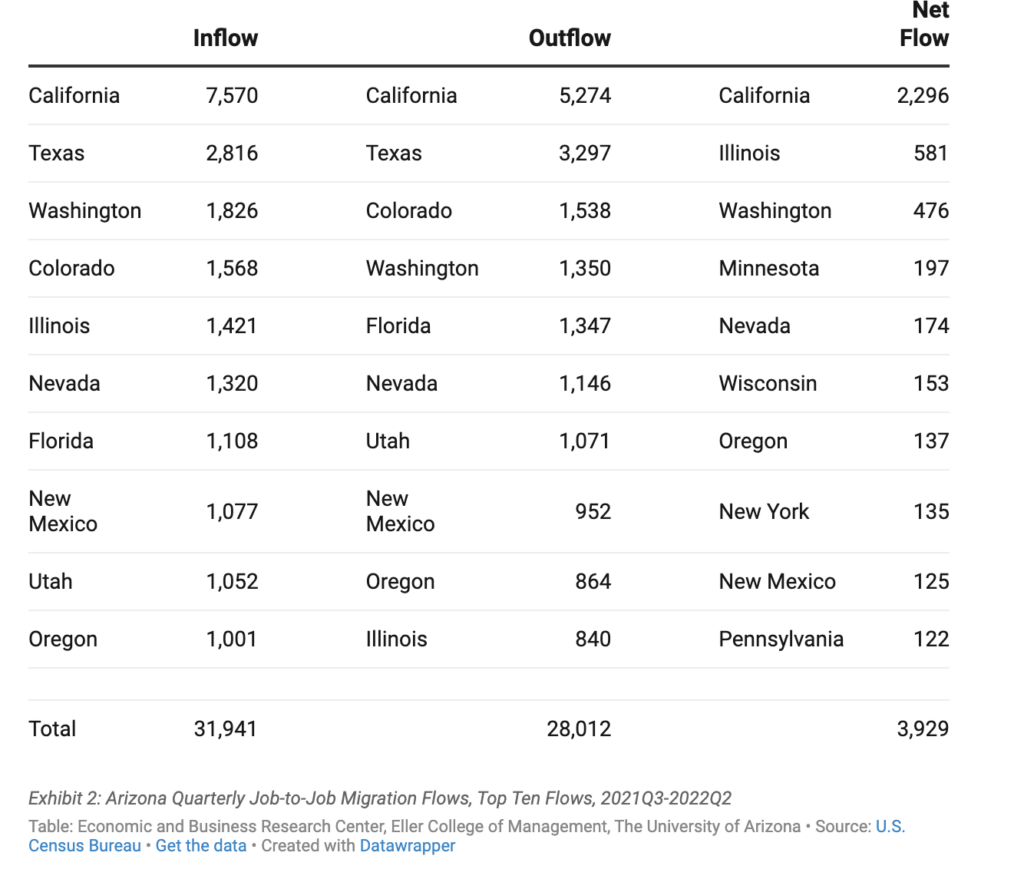
To be included in the origin-destination data, a worker must separate from a main job and be hired to a new main job with either no or just a brief unemployment spell. The data provide information about both the origin and the destination jobs. Exhibit 2 summarizes the quarterly results for Arizona from quarter three of 2021 to quarter two of 2022. Arizona saw in-migrant workers from 45 states and the District of Columbia, with either no migration or no data available from Alaska, Arkansas, Michigan, and Mississippi. It suggests that on average, 31,941 people moved from a job in another state to a job in Arizona each quarter, with little or no unemployment during the transition. California supplied by far the most workers, at 7,570, followed by Texas, Washington, and Colorado. California was also the main recipient of workers from Arizona, with 5,274 on average each quarter, followed by Texas, Colorado, and Washington. On net, California, Illinois, Washington, and Minnesota sent the most workers to Arizona during this period.
Exhibit 2: Arizona Quarterly Job-to-Job Migration Flows, Top Ten Flows, 2021Q3-2022Q2
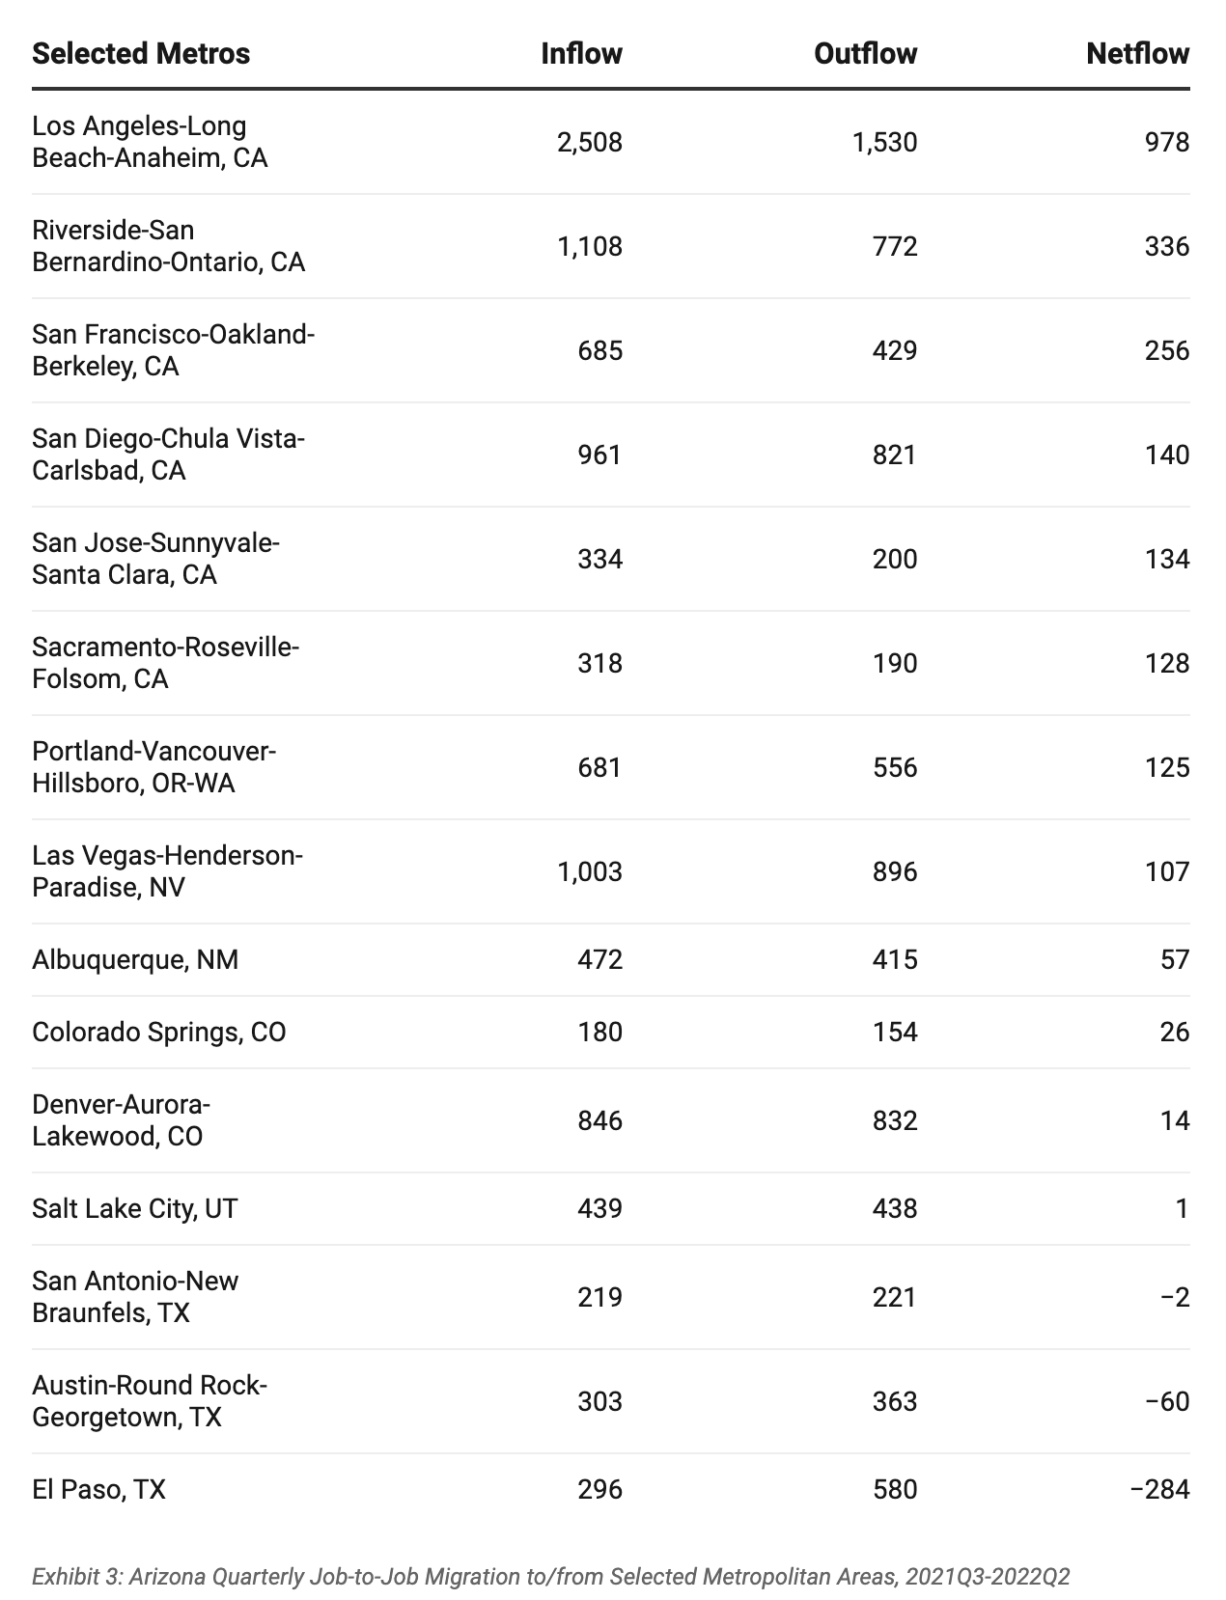
Migration flows between metropolitan areas hold significant importance due to their potential to foster economic growth, cultural exchange, and innovation. As individuals and families move to regions with similar economic and social characteristics, they contribute to a vibrant workforce, skill-sharing, and cross-industry collaboration. Exhibit 3 highlights migration flows to and from Arizona to selected metropolitan areas. Notably, Los Angeles seems to contribute the greatest net in-migration to Arizona, while El Paso exhibits the most pronounced net out-migration.
Exhibit 3: Arizona Quarterly Job-to-Job Migration to/from Selected Metropolitan Areas, 2021Q3-2022Q2
Author:Delaney O’Kray-Murphy is an Economic and Business Research Center research economist.