The nation’s apartment market saw a reversal in rent growth trends in 3rd quarter 2018, as previously slowing price positioning suddenly rose again. While nearly all top 50 markets picked up some momentum in recent months, a handful progressed at an especially solid pace, according to RealPage, the leading global provider of software and data analytics to the real estate industry.
U.S. apartment rental rates climbed 3.0% year-over-year as of 3rd quarter, notably above the 2.5% increase from 2nd quarter. This was the first time in roughly four years that rent growth momentum took such a significant upward turn of 50 basis points (bps) or more.
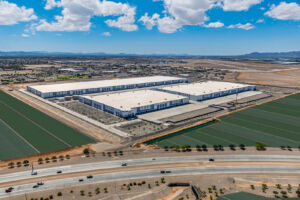
In Phoenix, there was 6.3% rent growth year-over year in the 3rd quarter 2018.
Among the nation’s 50 largest markets, Austin logged the most improvement recently, with rental rates going from essentially flat in 2nd quarter to growth of 2.6% in 3rd quarter – an increase of 200 bps. In fact, this was Austin’s heartiest price increase in two years, following a period of rent growth draught that lasted for five consecutive quarters. All product classes logged positive momentum in recent months, though the Class B and C units recorded more significant boosts after several quarters of flat prices or rent cuts.
Most submarkets across Austin also logged at least some progress, though Northwest Austin and Pflugerville made the greatest headway, after recording some of the market’s steepest rent cuts in 2nd quarter. Meanwhile, Austin’s urban core, which is already very expensive compared to the suburban submarkets, is back to being the Texas capital’s rent growth leader, with a year-over-year hike of 5.1%, though that growth is only marginally above the increase logged in downtown in mid-2018.
Meanwhile, Phoenix rents climbed 6.3% year-over-year, following a more moderate increase of 4.8% in 2nd quarter. This annual performance ranked third best among the nation’s largest markets and came in well ahead of the 4% average price increase Phoenix has seen throughout the current economic cycle. All product lines recorded notable upturns between mid- and fall 2018 performances. But the standout was the Class A stock, which built upon the already strong price increases this product line has seen recently, despite record competition levels. Submarkets where rent growth jumped significantly in 3rd quarter included East Mesa, South Phoenix and Deer Valley.

San Jose went from rent growth of 3.9% in 2nd quarter to an increase of 4.9% in 3rd quarter. This was the market’s strongest annual rent hike since early 2016, before pricing power all but disappeared for a few years. The 3rd quarter showing also ranked San Jose at #5 for annual rent growth among the nation’s 50 largest markets. While the Class A stock in San Jose – some of the most expensive product in the country – saw rent growth soften recently, the Class B and C units logged considerable upward momentum.
North San Jose/Milpitas and East San Jose were the San Jose submarkets that logged the biggest upturn in rents in recent months. While Class C stock was the clear winner in these neighborhoods, Class A product also saw a notable upturn in North San Jose/Milpitas, where both apartment supply and demand have been considerable during the current cycle.
After registering an essentially flat rent performance in 2nd quarter, Chicago made notable improvement in 3rd quarter, with annual price growth swelling to 1.3% – an increase of 100 bps. While this remains one of the poorest year-over-year showings among the top 50 markets, the new progress marks a hopeful change following eight consecutive quarters of price softening in Chicago.
All product segments in the Windy City recorded price bumps in 3rd quarter, but the Class A stock saw the most impressive movement, especially in Bronzeville/Hyde Park/South Shore, Streeterville/River North and The Loop, which were also the submarket-level leaders for rent growth upturns. This is quite a change for Chicago’s Class A product line, which had been struggling in the face of big supply volumes in the past year or so.
Annual rent growth in Washington, DC was at 1.1% in 2nd quarter but climbed to 2% in 3rd quarter. It’s been more than two years since price increases here hit the 2% mark. Still, like Chicago, Washington, DC’s year-over-year showing remains near the bottom of the performance spectrum across the 50 largest metros. Additionally, when looking at the U.S. capital’s pricing performance during the current economic cycle, the market has registered one of the slowest growth rates in the nation.
The upturn in rent growth between 2nd quarter and 3rd quarter was relatively balanced across all product classes in DC, but the Class A stock, which has faced stiff competition recently, has made the most improvement over the past few years. Loudoun County, Suitland/District Heights/Capitol Heights and Central DC made the most progress between 2nd quarter and 3rd quarter. In Loudoun County and Central DC, rents went from essentially flat or falling at mid-year to moderate upturns by fall 2018. In Suitland/District Heights/Capitol Heights, however the mid-year performance was already strong, but got even stronger in the past few months. Year-over-year rent change was at 6% in 3rd quarter in this neighborhood, the best rate seen across Washington, DC.


