Arizona was one of eight states plus the District of Columbia to experience depreciation in house prices in the second quarter of 2023 with a one-year change of -2.5%. The Federal Housing Finance Agency (FHFA) indicated in its August 29 release that house prices in the U.S. increased 3.0% between the second quarters of 2022 and 2023. Prices rose in 42 states with Maine reporting the largest change at 7.6% while prices in Nevada decreased the most at -5.3%. Except for the District of Columbia, the states with decreasing house prices were all in the West (Pacific and Mountain regions). State and national level data here represent the purchase-only index, while metropolitan areas are available with the all-transactions index, including purchase and refinance mortgages. Arizona metropolitan areas had a mix of positive and decreased annual price changes for the second quarter of 2023. All were far below the one-year price changes experienced in the second quarter of 2022 (which ranged from 21.1% to 30.3%). The percent change in house prices for Arizona metropolitan areas in the second quarter of 2023 were: -2.7% in Phoenix, -1.9% in Lake Havasu City-Kingman, 0.1% in Prescott Valley-Prescott, 1.0% in Flagstaff, 3.9% in Tucson, 4.3% in Sierra Vista-Douglas, and 4.3% in Yuma.
READ MORE: 700-acre Prescott ranch will become Stringfield at Granite Mountain community
The July 2023 release of the Job Openings and Labor Turnover (JOLTS) report indicated the number of job openings in the U.S. edged down to 8.8 million, while the rate changed minimally to 5.3%. Industries with the largest increase in job openings were information followed by transportation, warehousing, and utilities. Notable decreases in job openings occurred in the professional and business services, healthcare, and government sectors. The number of hires nationally was 5.8 million, with a rate of 3.7%. Total separations in the nation were little changed at 5.5 million, with a separation rate of 3.5%. The number and rate of quits decreased by 3.5 million and 2.3%, respectively. The number of layoffs and discharges underwent minimal change at 1.6 million and 1.0%. Other separations in the U.S. were little changed, reporting at 378,000.
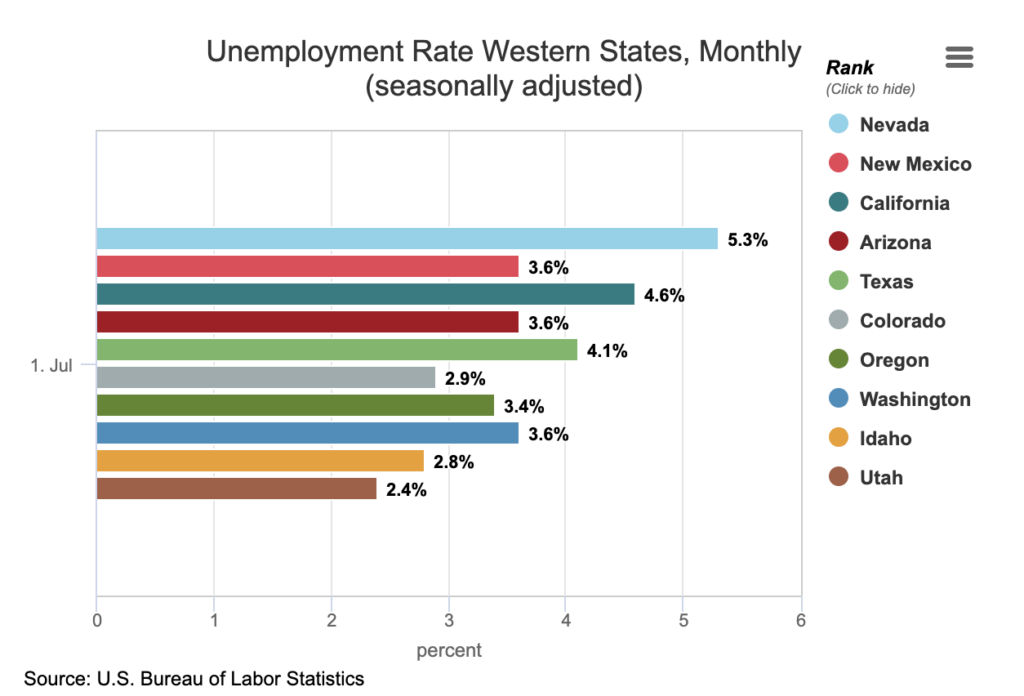
Total nonfarm employment in Arizona increased by 60,300 jobs year-over-year in July. The seasonally adjusted unemployment rate for Arizona increased 0.1 percentage points over the month to 3.6%. The U.S. seasonally adjusted unemployment rate decreased 0.1 percentage points to 3.5% in July. Over the month, Arizona’s non-seasonally adjusted total nonfarm employment decreased by 11,600, a smaller loss than the pre-pandemic average decrease of 19,800. Employment losses occurred in professional & business services (-5,000); leisure & hospitality (-4,700); trade, transportation & utilities (-2,000); other services (-1,800); private education & health services (-1,000); government (-200); manufacturing (-200); and natural resources & mining (-100). Employment gains were reported in financial activities (1,700) and construction (1,700).
July over-the-month state unemployment rates were lower in seven states, higher in three states, and stable in the remaining 40 states. Arizona, Idaho, and Wisconsin saw unemployment rate increases of 0.1 percentage points, while Pennsylvania, Louisiana, Maryland, Virginia, and Washington all saw unemployment rate decreases. Over the year, 23 states had decreased jobless rates, five states saw increases, and 22 states had little to no change. The District of Columbia and California saw the largest unemployment rate increases at 0.9 and 0.8 percentage points, respectively, while Maryland experienced the most significant decrease, shrinking by 1.4 percentage points. Nonfarm payroll employment increased over the month in four states: Florida, Indiana, Hawaii, and Vermont, and was essentially unchanged in the remaining 46. Over the year, nonfarm payroll employment increased in 36 states and was essentially unchanged in the remaining 14. The largest increases occurred in Texas, California, and Florida.
In July, over-the-year metropolitan unemployment rates were lower in 192 of 389 metropolitan areas, higher in 176, and unchanged in the remaining 21. The July unemployment rates for the Tucson and Phoenix metropolitan areas came in at 4.7% and 4.2%, respectively. Yuma had the highest unemployment rate in Arizona at 16.7%, while Phoenix had the lowest. Sioux Falls, SD, had the lowest unemployment rate in the nation at 1.4%, followed by Burlington-South Burlington, VT, at 1.5%, and Rapid City, SD, at 1.6%. On the other hand, El Centro, CA, had the highest unemployment rate at 17.7%. California-Lexington Park, MD, and Johnstown, PA, both saw the largest over-the-year decreases in unemployment with -1.8 percentage points each. El Centro, CA, had the most significant rate increase in July, moving up 2.5 percentage points, followed closely by Elkhart-Goshen, IN with 2.4 percentage points.
There were 537,216 nonemployer businesses in Arizona in 2020, most being individual proprietorships based on the U.S. Census Bureau 2020 Nonemployer Statistics August 17 release. Most business establishments in the nation and Arizona are small businesses with no paid employees or payroll, making this annual series worth tracking. Data are available on the number of businesses and total receipts by industry down to the county level for businesses that have no paid employees or payroll, are subject to federal income tax, and have receipts of $1,000 or more ($1 or more for the construction sector). The industry with the most nonemployer establishments in Arizona and the nation was professional, scientific, and technical services while utilities had the fewest number for both the state and the U.S. As one would expect, given its proportionate size, Maricopa County had the highest number of nonemployer businesses in the state, followed by Pima County.
Real gross domestic product (GDP) increased at an annual rate of 2.1% in the second quarter of 2023, according to the second estimate released by the Bureau of Economic Analysis. In the first quarter, GDP rose by an annual rate of 2.0%. This second quarter estimate shows a 0.3 percentage point downward revision from the advance estimate provided last month. The updated estimate reflects downward revisions to private inventory investment and nonresidential fixed investment and an upward revision to state and local government spending. Real gross domestic income, an alternate measure of GDP, increased by 0.5% in the second quarter, in contrast to a decrease of 1.8% in the first quarter.
Authors: This story was written by Delaney O’Kray-Murphy, EBRC research economist; Valorie Rice, senior business information specialist; and Alexandra Jaeger, EBRC web applications developer.